

doi: 10.1016/j.str.2012.01.010.
The Protein Data Bank at 40: reflecting on the past to prepare for the future
Affiliations
- PMID: 22404998
- PMCID: PMC3501388
- DOI: 10.1016/j.str.2012.01.010
Item in Clipboard
The Protein Data Bank at 40: reflecting on the past to prepare for the future
Structure.
.
Abstract
A symposium celebrating the 40th anniversary of the Protein Data Bank archive (PDB), organized by the Worldwide Protein Data Bank, was held at Cold Spring Harbor Laboratory (CSHL) October 28-30, 2011. PDB40's distinguished speakers highlighted four decades of innovation in structural biology, from the early era of structural determination to future directions for the field.
Copyright © 2012 Elsevier Ltd. All rights reserved.
Figures
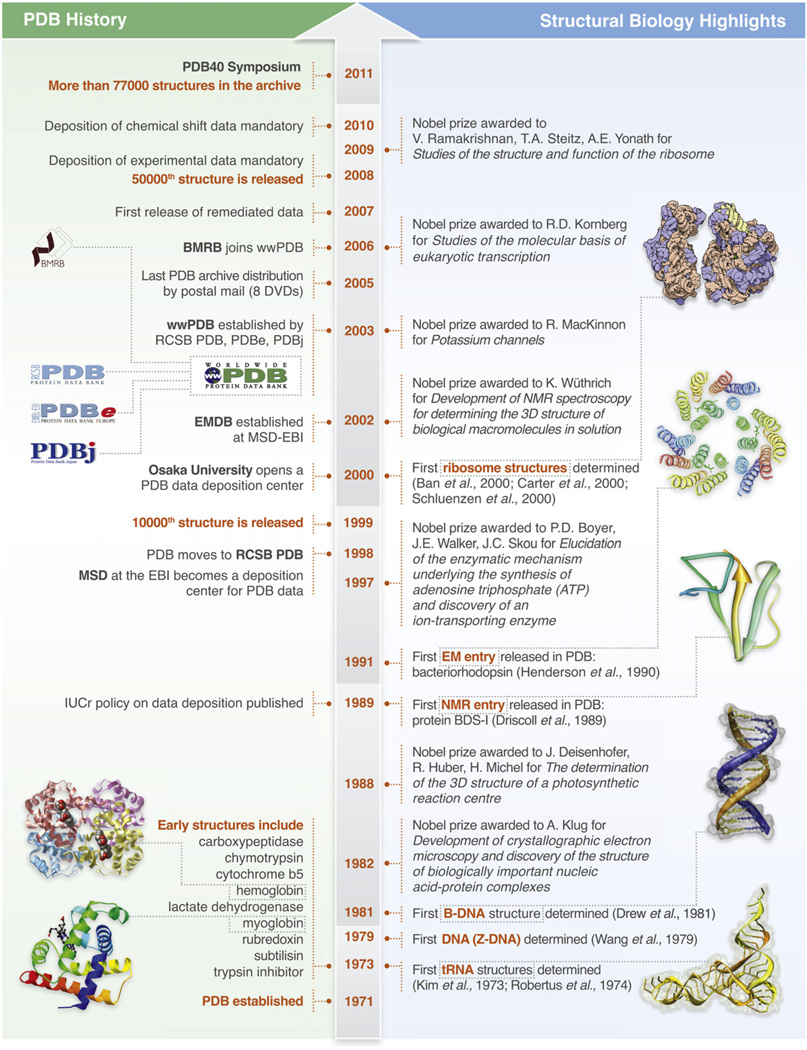
(Left) Key events in the evolution of the PDB. (Right) selected key structures in the field of structural biology (Ban et al., 2000; Carter et al., 2000; Schluenzen et al., 2000; Henderson et al., 1990; Driscoll et al., 1989; Drew et al., 1981; Wang et al., 1979; Kim et al., 1973; Robertus et al., 1974).

Members of the PDB team who attended the conference, including members from RCSB PDB, PDBe, PDBj, BMRB, and BNL. Photo by Constance Brukin used with permission. Additional information about the symposium is available from the wwPDB site (http://wwpdb.org ).
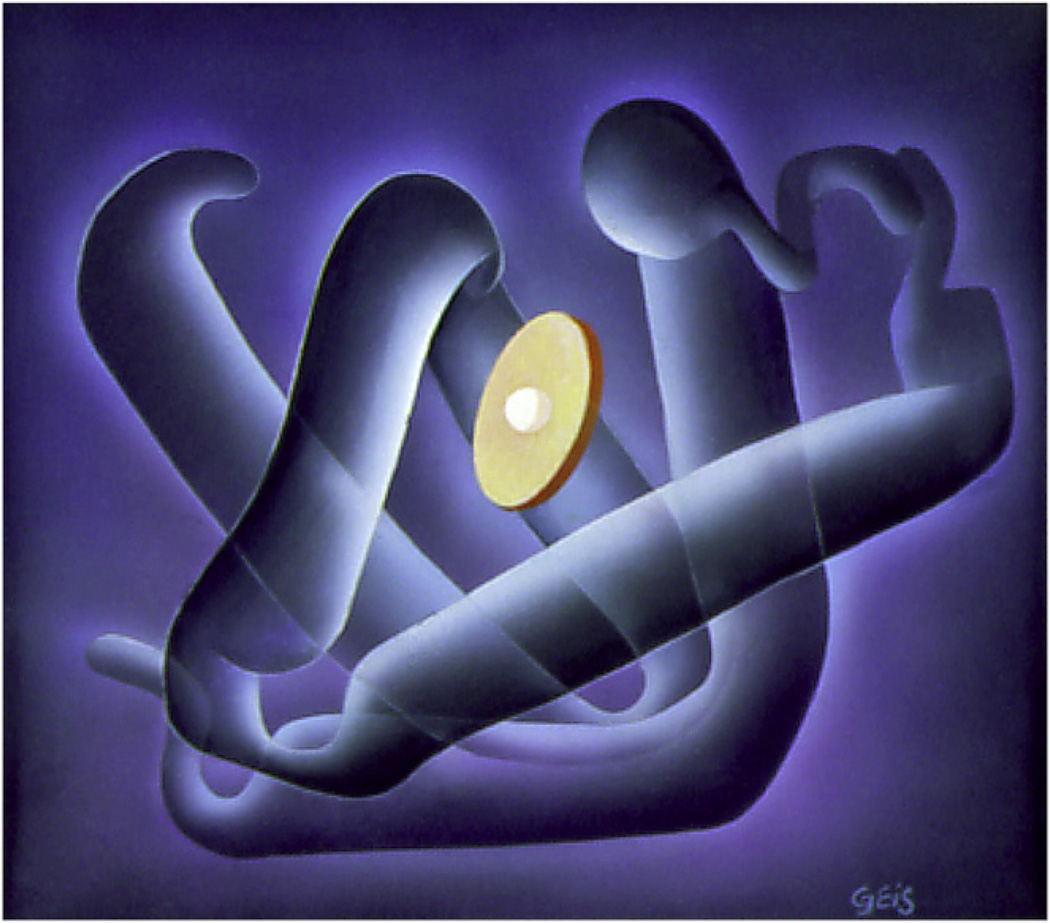
Illustration, Irving Geis. The protein chain is shown in blue, and the heme is shown as a gold disk. Illustration, Irving Geis. Image from the Irving Geis Collection, Howard Hughes Medical Institute. Rights owned by HHMI. Not to be reproduced without permission. Reprinted here with permission.
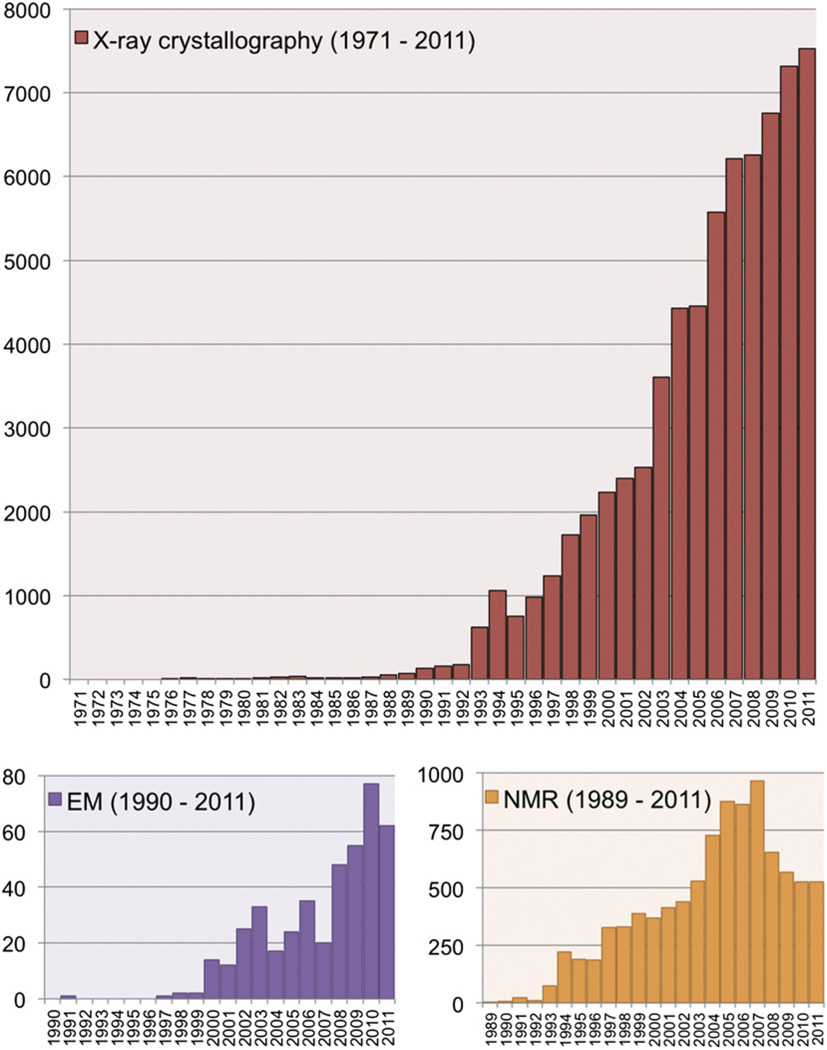
X-ray structure counts are shown in red, EM structure counts in purple, and NMR structure counts in orange.
References
-
- Ban N, Nissen P, Hansen J, Moore PB, Steitz TA. Science. 2000;289:905–920. - PubMed
-
- Berman HM. Acta Crystallogr. A. 2008;64:88–95. - PubMed
-
- Berman HM, Henrick K, Nakamura H. Nat. Struct. Biol. 2003;10:980. - PubMed
-
- Bernstein FC, Koetzle TF, Williams GJB, Meyer EF, Jr, Brice MD, Rodgers JR, Kennard O, Shimanouchi T, Tasumi M. J. Mol. Biol. 1977;112:535–542. - PubMed
-
- Carter AP, Clemons WM, Brodersen DE, Morgan-Warren RJ, Wimberly BT, Ramakrishnan V. Nature. 2000;407:340–348. - PubMed
Publication types
MeSH terms
Grants and funding
LinkOut - more resources
Full Text Sources
Miscellaneous
