. 2012 Apr;122(4):1469-86.
doi: 10.1172/JCI57349. Epub 2012 Mar 12.

G9a interacts with Snail and is critical for Snail-mediated E-cadherin repression in human breast cancer

Affiliations

G9a interacts with Snail and is critical for Snail-mediated E-cadherin repression in human breast cancer

Chenfang Dong et al. J Clin Invest. 2012 Apr.

Abstract

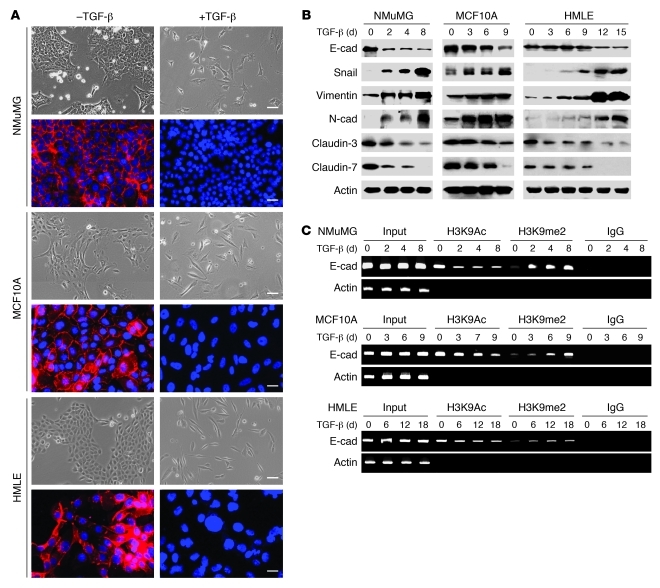
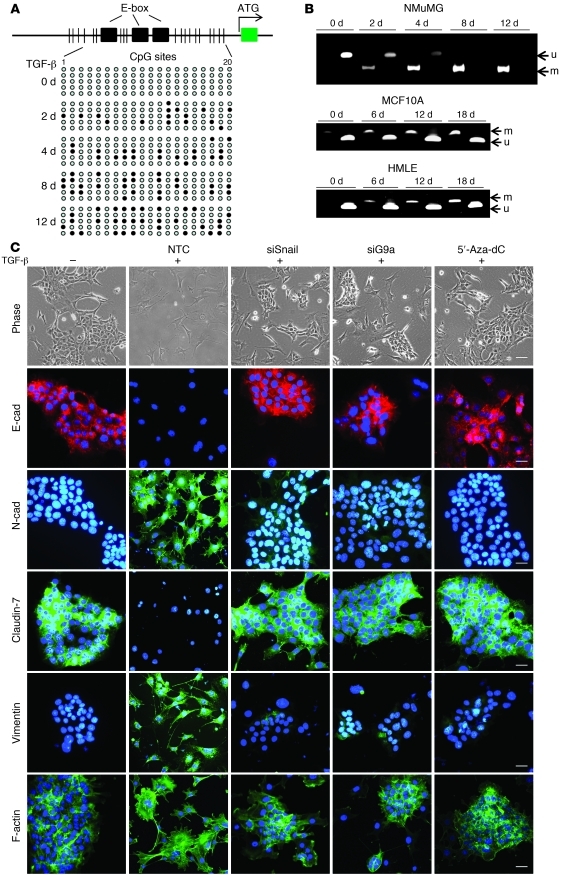
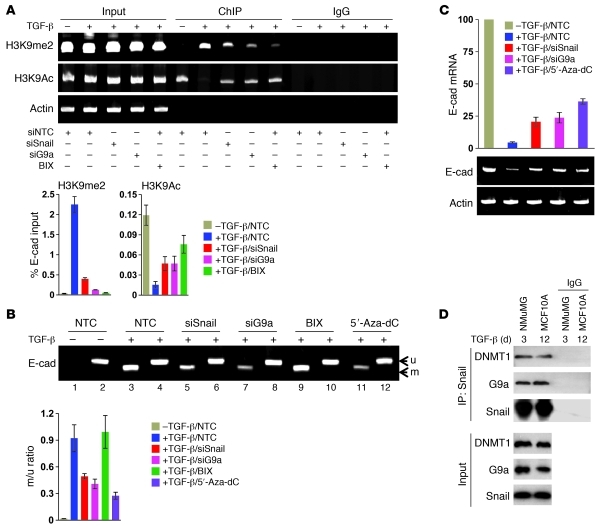
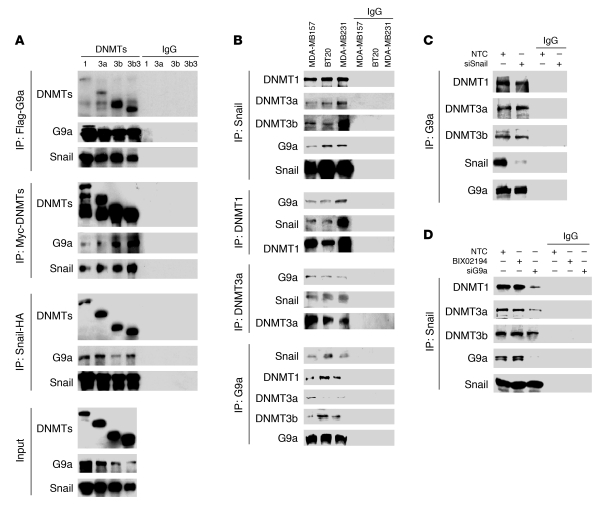
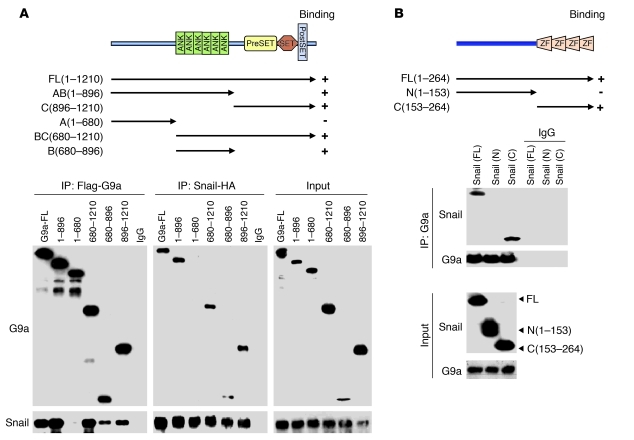
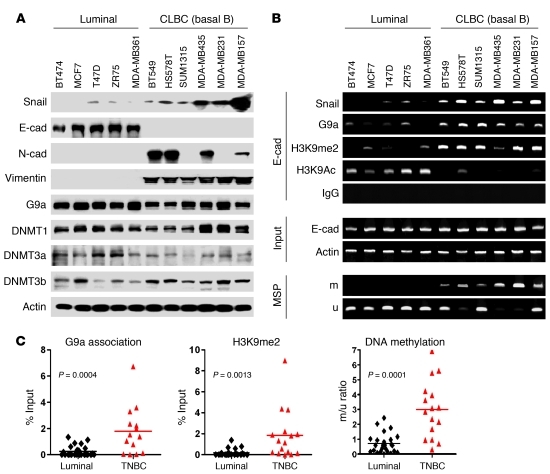
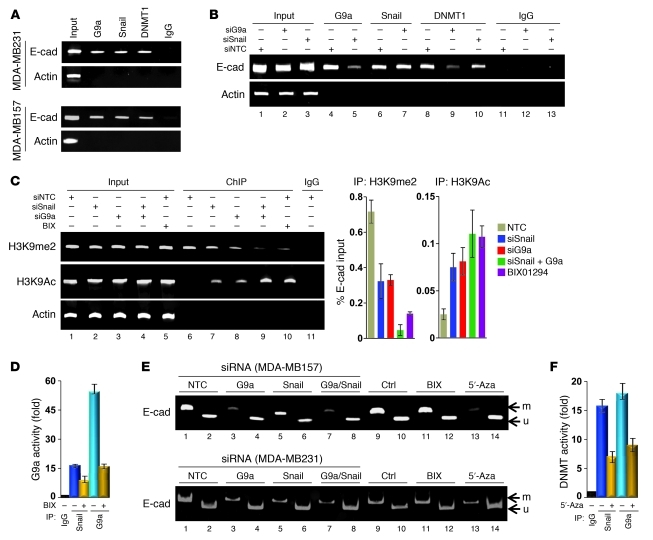
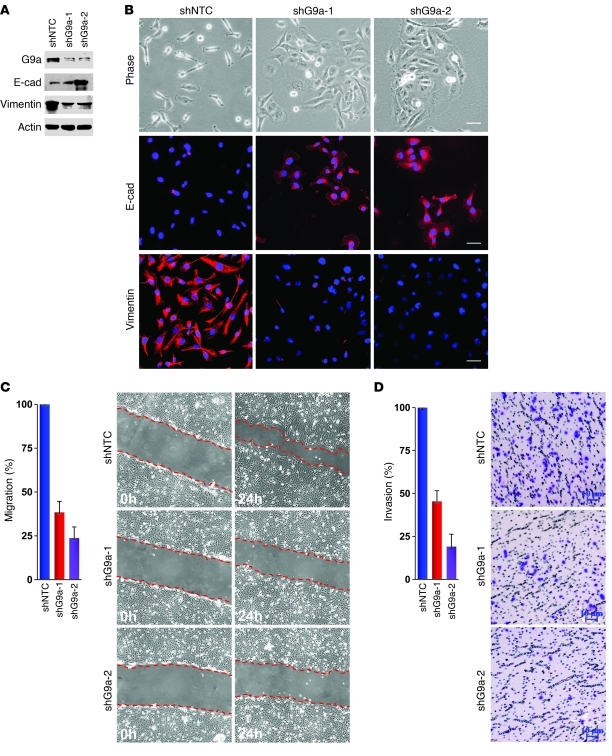
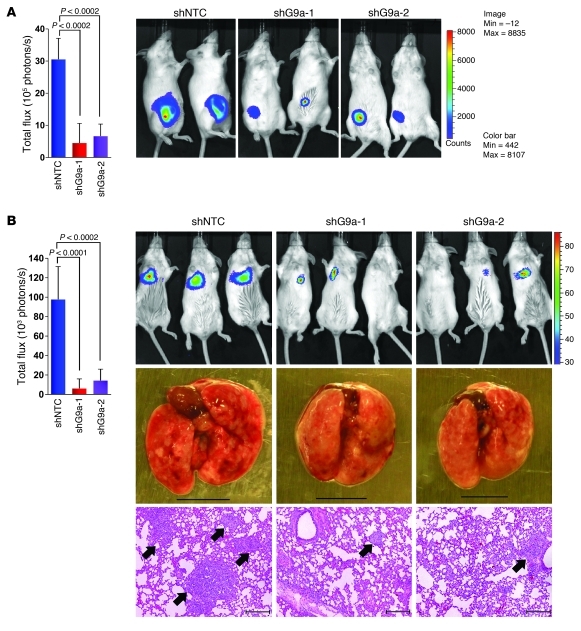
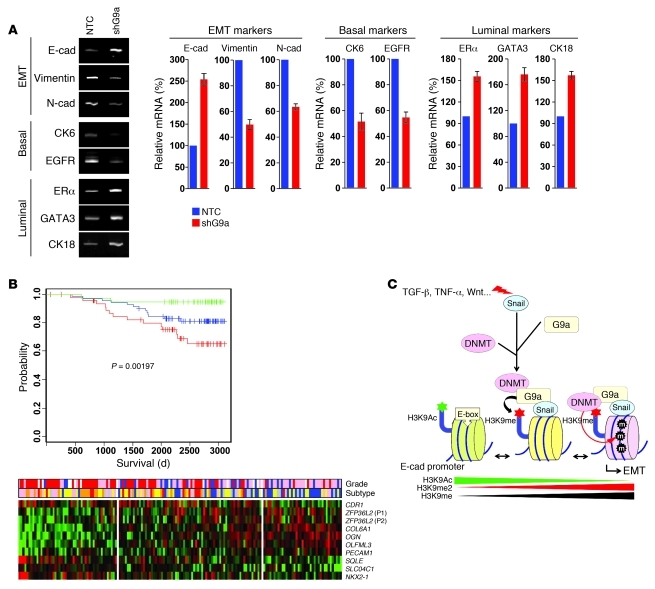
Breast cancers are highly heterogeneous but can be grouped into subtypes based on several criteria, including level of expression of certain markers. Claudin-low breast cancer (CLBC) is associated with early metastasis and resistance to chemotherapy, while gene profiling indicates it is characterized by the expression of markers of epithelial-mesenchymal transition (EMT) - a phenotypic conversion linked with metastasis. Although the epigenetic program controlling the phenotypic and cellular plasticity of EMT remains unclear, one contributor may be methylation of the E-cadherin promoter, resulting in decreased E-cadherin expression, a hallmark of EMT. Indeed, reduced E-cadherin often occurs in CLBC and may contribute to the early metastasis and poor patient survival associated with this disease. Here, we have determined that methylation of histone H3 on lysine 9 (H3K9me2) is critical for promoter DNA methylation of E-cadherin in three TGF-β-induced EMT model cell lines, as well as in CLBC cell lines. Further, Snail interacted with G9a, a major euchromatin methyltransferase responsible for H3K9me2, and recruited G9a and DNA methyltransferases to the E-cadherin promoter for DNA methylation. Knockdown of G9a restored E-cadherin expression by suppressing H3K9me2 and blocking DNA methylation. This resulted in inhibition of cell migration and invasion in vitro and suppression of tumor growth and lung colonization in in vivo models of CLBC metastasis. Our study not only reveals a critical mechanism underlying the epigenetic regulation of EMT but also paves a way for the development of new treatment strategies for CLBC.


Figures

Figure 1
Figure 1. H3K9 methylation at the E-cadherin promoter is associated with TGF-β–induced EMT in three model cell lines.
(A) NMuMG, MCF10A, and HMLE cells were treated with TGF-β1 (5 ng/ml) for 3, 9, and 12 days, respectively; cell morphological changes associated with EMT are shown in the phase contrast images. Expression of E-cadherin (red) was analyzed by immunofluorescence staining. Nuclei were visualized with DAPI staining (blue). Scale bars: 50 μm. (B) NMuMG, MCF10A, and HMLE cells were treated with TGF-β1 (5 ng/ml) for the indicated time periods, and expression of E-cadherin (E-cad), claudin-3, claudin-7, Snail, N-cadherin, and vimentin in these cells was analyzed by Western blotting. (C) NMuMG, MCF10A, and HMLE cells were treated with TGF-β1 (5 ng/ml) for different time periods, and H3K9me2 and H3K9Ac at the E-cadherin promoter in these cell lines were analyzed by ChIP assay.
Figure 2
Figure 2. G9a is critical for TGF-β–induced EMT.
(A) Schematic diagram showing the position of 3 E-box and CpG dinucleotides at the promoter region of E-cadherin. NMuMG cells were treated with TGF-β1 (5 ng/ml) for different time periods, and EMT-mediated methylation of the E-cadherin promoter was analyzed by bisulfite sequencing. (B) NMuMG, MCF10A, and HMLE cells were treated with TGF-β1 (5 ng/ml) for the indicated time periods, and EMT-mediated E-cadherin promoter methylation was examined by MSP. m, methylated; u, unmethylated. (C) G9a, Snail, or non-target control (NTC) siRNA was expressed in NMuMG cells followed by TGF-β treatment for 2 days or cells were treated with 5′-Aza-dC. Plus and minus signs indicate treatment with and without TGF-β1, respectively. The morphological changes are shown in the phase contrast images. Expression of E-cadherin, N-cadherin, claudin-7, vimentin, and alternation of lamellipodia (staining with actin-phalloidin) was analyzed by immunofluorescence staining. Scale bars: 30 μm.
Figure 3
Figure 3. G9a is required for H3K9me2 and DNA methylation at the E-cadherin promoter.
(A) G9a, Snail, or NTC siRNA was expressed in, or BIX01294 (BIX; 2.5 μM) was added to NMuMG cells followed by treatment with or without TGF-β1 (5 ng/ml) for 3 days. H3K9me2 and H3K9 acetylation at the E-cadherin promoter was analyzed by ChIP. ChIP samples were also analyzed by quantitative real-time PCR (mean ± SD from 3 separate experiments; bottom panel). (B) NMuMG cells were treated as described in A. DNA methylation at the E-cadherin promoter was analyzed by MSP. Samples from MSP analyses were also analyzed by quantitative real-time PCR, and the ratio of methylated to unmethylated DNA was plotted (mean ± SD from 3 separate experiments; bottom panel). (C) NMuMG cells were treated as described in B. The expression of E-cadherin mRNA was analyzed by either semi-quantitative RT-PCR (bottom panel) or quantitative real-time PCR (top panel) (mean ± SD from 3 separate experiments). (D) NMuMG and MCF10A cells were treated with TGF-β1 for 3 and 12 days, respectively. After immunoprecipitation of endogenous Snail, associated endogenous G9a and DNMT1 were analyzed by Western blotting.
Figure 4
Figure 4. G9a forms a complex with Snail and DNMTs.
(A) HEK293 cells were transiently coexpressed with Flag-tagged G9a, HA-tagged Snail, and Myc-tagged DNMTs. Cell extracts were immunoprecipitated separately with Flag, HA, or Myc antibodies, and the associated G9a, Snail, and DNMTs were examined by Western blotting, respectively. (B) Endogenous Snail, G9a, and DNMTs were immunoprecipitated from MDA-MB157, BT20, and MDA-MB231 cells, and bound endogenous Snail, G9a, and DNMTs were examined by Western blotting. (C) Snail or NTC siRNA was expressed in MDA-MB157 cells, and after immunoprecipitation of endogenous G9a, bound Snail and DNMTs was subjected to Western blotting. (D) G9a or NTC siRNA was expressed in MDA-MB157 cells, or cells were treated with the G9a inhibitor BIX01294 (2.5 μM), and after immuno­precipitating endogenous Snail, bound DNMTs and G9a were subjected to Western blotting.
Figure 5
Figure 5. G9a interacts with Snail directly.
(A) Schematic diagram showing the structure of G9a and the different deletion constructs (top panel). HEK293 cells were transiently coexpressed with plasmids encoding Flag-tagged full-length (FL) or deletion mutants (designated A, B, and C) of G9a and HA-tagged Snail. Extracts were immunoprecipitated with Flag or HA antibodies, and bound G9a or Snail was examined by Western blotting. (B) Schematic diagram showing the structure of Snail and two deletion mutants (top panel). Full-length and deletion mutants of Snail were coexpressed with G9a in HEK293 cells. After immunoprecipitation of G9a, associated Snail was analyzed by Western blotting. ZF, zinc finger.
Figure 6
Figure 6. G9a-related repressive marks are enriched at the E-cadherin promoter in CLBC cell lines and tumor samples.
(A) Cell extracts were prepared from 5 luminal and 6 claudin-low subtypes of human breast cancer cell lines, and expression of Snail, G9a, DNMT1, and other EMT markers was analyzed by Western blotting. (B) The association of G9a, Snail, and the level of H3K9me2 and H3K9 acetylation at the E-cadherin promoter in various cell lines was analyzed with the ChIP assay. Methylation of the E-cadherin promoter in various breast cell lines was examined by MSP (bottom 2 panels). (C) The association of G9a, H3K9me2, and DNA methylation at the E-cadherin promoter in fresh frozen human tumor tissues of luminal (25 cases) and triple-negative (16 cases) breast cancer was analyzed by ChIP and MSP, respectively. Statistical analyses (mean ± SD) for the association of G9a (0.26 ± 0.08 versus 1.68 ± 0.44), H3K9me2 (0.18 ± 0.07 versus 1.83 ± 0.6), and DNA methylation (0.70 ± 0.13 versus 3.00 ± 0.48) is shown in the distribution plots. TNBC, triple negative breast cancer.
Figure 7
Figure 7. G9a is recruited to the E-cadherin promoter for epigenetic silencing of E-cadherin expression.
(A) The association of endogenous G9a, Snail, and DNMT1 at the E-cadherin promoter was analyzed by ChIP. (B) G9a, Snail, or NTC siRNA was expressed in MDA-MB157 cells, and the association of endogenous G9a, Snail, and DNMT1 at the E-cadherin promoter was analyzed with the ChIP assay. Results of quantitative real-time PCR are presented on Supplemental Figure 10. (C) G9a, Snail, or NTC siRNA was expressed in MDA-MB157 cells, or cells were treated with BIX01294 (2.5 μM); H3K9me2 and H3K9 acetylation at the E-cadherin promoter was analyzed by the ChIP assay. Results of quantitative real-time PCR are presented in the right panels (mean ± SD from 3 separate experiments). (D) Statistical analysis of the in vitro G9a methylation assay, mean ± SD from 3 independent experiments, is shown. (E) G9a, Snail, or NTC siRNA was expressed in MDA-MB157 and MDA-MB231 cells, or these cells were treated with the DNMT inhibitor 5′-Aza-dC (5′-Aza; 10 μM), and DNA methylation at the E-cadherin promoter was analyzed by MSP. Ctrl, control. (F) Statistical analysis of the in vitro DNA methylation assay, mean ± SD from 3 independent experiments, is shown.
Figure 8
Figure 8. Knockdown of G9a expression inhibits breast cancer cell migration and invasion in vitro.
(A) MDA-MB231 cells stably expressing control vector or G9a shRNA were examined for the expression of G9a, E-cadherin, and vimentin by Western blotting. (B) Morphological changes in MDA-MB231 cells and stable transfectants with knockdown of G9a are shown in the phase contrast images. Expression of E-cadherin and vimentin in these cells was analyzed by immunofluorescence staining. Nuclei were stained with DAPI (blue). Scale bars: 25 μm. (C) The migratory ability of MDA-MB231 cells and the corresponding stable transfectants with knockdown of G9a expression was analyzed by wound healing assay. Statistical analysis for the cell migration is shown in the bar graph (mean ± SD from 3 independent experiments), and a representative experiment is shown in the right panel. Scale bars: 100 μm. (D) The invasiveness of MDA-MB231 cells stably expressing control vector or G9a shRNA was analyzed with a modified Boyden chamber invasion assay. The percentage of invasive cells is shown in the bar graph (mean ± SD from 3 separate experiments), and a representative experiment is shown in the right panel. Scale bars: 10 μm.
Figure 9
Figure 9. Knockdown of G9a expression suppresses breast tumor growth and lung colonization in vivo.
(A) MDA-MB231 cells stably expressing control vector or G9a shRNA were injected into the mammary fat pad of ICR-SCID mice. The growth of breast tumors was monitored every 3 days. After 9 weeks, the size of tumors from each group was recorded by using bioluminescence imaging and quantified by measuring photon flux. Values are the mean of 6 animals ± SEM. (B) Cells from A were also injected into the tail vein of ICR-SCID mice. After 9 weeks, the development of lung metastases was recorded using bioluminescence imaging and quantified by measuring photon flux (mean of 6 animals ± SEM). Results for 3 representative mice from each group are shown. Mice were sacrificed, and lung metastatic nodules were examined macroscopically or detected in paraffin-embedded sections stained with H&E. Scale bars: 100 μm. Arrowheads indicate lung metastases.
Figure 10
Figure 10. Knockdown of G9a expression alters the expression of epithelial and mesenchymal markers associated with EMT.
(A) The differentially expressed markers for EMT and basal and luminal breast cancer from MDA-MB231 cells and the corresponding stable clone with knockdown of G9a expression were analyzed by quantitative RT-PCR. (B) Kaplan-Meier overall survival curve separates the tumors (from GSE1456) into 3 groups with expression of a 9-gene prognostic signature (top panel). Expression of the 9-gene signature in 159 breast cancer patients is shown in the heatmap (bottom panel). Top bars: tumor grade (1: blue, 2: pink, 3: red) and tumor subtypes (normal-like: blue, luminal A: yellow, luminal B: orange, basal: pink, HER2-positive: red]). P1, probe 1; P2, probe 2. (C) A proposed model to illustrate the interaction of Snail with G9a and DNMTs leading to E-cadherin promoter methylation and EMT induction (see Discussion).

References

    1. Hennessy BT, et al. Characterization of a naturally occurring breast cancer subset enriched in epithelial-to-mesenchymal transition and stem cell characteristics. Cancer Res. 2009;69(10):4116–4124. - PMC - PubMed
    1. Prat A, et al. Phenotypic and molecular characterization of the claudin-low intrinsic subtype of breast cancer. Breast Cancer Res. 2010;12(5):R68. doi: 10.1186/bcr2635. - DOI - PMC - PubMed
    1. Taube JH, et al. Core epithelial-to-mesenchymal transition interactome gene-expression signature is associated with claudin-low and metaplastic breast cancer subtypes. Proc Natl Acad Sci U S A. 2010;107(35):15449–15454. - PMC - PubMed
    1. Visvader JE. Keeping abreast of the mammary epithelial hierarchy and breast tumorigenesis. Genes Dev. 2009;23(22):2563–2577. doi: 10.1101/gad.1849509. - DOI - PMC - PubMed
    1. Herschkowitz JI, et al. Identification of conserved gene expression features between murine mammary carcinoma models and human breast tumors. Genome Biol. 2007;8(5):R76. doi: 10.1186/gb-2007-8-5-r76. - DOI - PMC - PubMed

Publication types

MeSH terms