. 2012 Apr;122(4):1416-26.
doi: 10.1172/JCI60746. Epub 2012 Mar 12.

The sphingosine-1-phosphate transporter Spns2 expressed on endothelial cells regulates lymphocyte trafficking in mice

Affiliations

The sphingosine-1-phosphate transporter Spns2 expressed on endothelial cells regulates lymphocyte trafficking in mice

Shigetomo Fukuhara et al. J Clin Invest. 2012 Apr.

Abstract

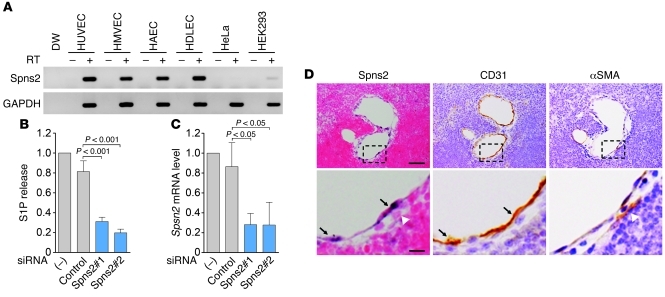
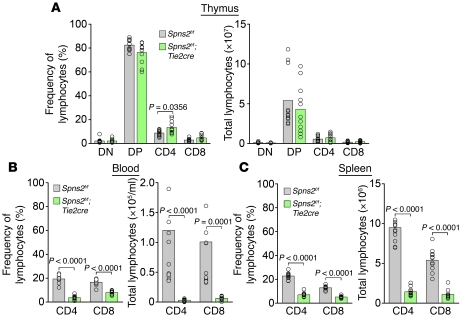
The bioactive lysophospholipid mediator sphingosine-1-phosphate (S1P) promotes the egress of newly formed T cells from the thymus and the release of immature B cells from the bone marrow. It has remained unclear, however, where and how S1P is released. Here, we show that in mice, the S1P transporter spinster homolog 2 (Spns2) is responsible for the egress of mature T cells and immature B cells from the thymus and bone marrow, respectively. Global Spns2-KO mice exhibited marked accumulation of mature T cells in thymi and decreased numbers of peripheral T cells in blood and secondary lymphoid organs. Mature recirculating B cells were reduced in frequency in the bone marrow as well as in blood and secondary lymphoid organs. Bone marrow reconstitution studies revealed that Spns2 was not involved in S1P release from blood cells and suggested a role for Spns2 in other cells. Consistent with these data, endothelia-specific deletion of Spns2 resulted in defects of lymphocyte egress similar to those observed in the global Spns2-KO mice. These data suggest that Spns2 functions in ECs to establish the S1P gradient required for T and B cells to egress from their respective primary lymphoid organs. Furthermore, Spns2 could be a therapeutic target for a broad array of inflammatory and autoimmune diseases.


Figures

Figure 1
Figure 1. Mature T and recirculating mature B lymphocytes are remarkably reduced in the peripheral blood of Spns2–/– mice.
(A and B) Flow cytometric analyses of control (Spns2+/+) and global Spns2–/– mice. (A) Frequencies (left) and total numbers (right) of CD4 SP (CD4) and CD8 SP (CD8) T cells in peripheral blood are shown (n = 11). (B) Frequencies (left) and total numbers (right) of immature B cells (CD19+CD23IgDIgM+, immature B) and mature recirculating B cells (CD19+CD23+IgD+, Mature rec. B) in peripheral blood are shown (n = 11). In A and B, bars and circles indicate averages and values for individual mice, respectively.
Figure 2
Figure 2. Egress of mature T cells from the thymus is impaired in Spns2–/– mice.
(AD) Flow cytometric analyses of control (Spns2+/+) and global Spns2–/– mice. (A) A representative flow cytometric analysis of T cells in the thymus. The numbers represent the percentages of CD4 SP, CD8 SP, CD4/CD8 DP T cells, and CD4/CD8 DN thymocytes. (B) Frequencies (left) and total numbers (right) of CD4/CD8 DN (DN), CD4/CD8 DP (DP), CD4 SP (CD4) and CD8 SP (CD8) thymocytes and T cells are shown (n = 11). (C) Frequencies and numbers of CD4 SP (CD4) and CD8 SP (CD8) T cells in peripheral lymph nodes are shown (n = 11). (D) Frequencies and numbers of CD4 SP (CD4) and CD8 SP (CD8) T cells in spleens are shown (n = 11). In BD, bars and circles indicate averages and values for individual mice, respectively. (E) Spleen sections from control (Spns2+/+) or Spns2–/– mice, stained to detect CD3+ T cells (blue) and B220+ B cells (red). The boxed areas of upper panels are enlarged in lower panels. Scale bars: 200 μm (top row); 50 μm (bottom row).
Figure 3
Figure 3. Immature B cell egress from bone marrow is impaired in Spns2–/– mice.
(AD) Flow cytometric analysis of B cells in control (Spns2+/+) and Spns2–/– mice. (A) A representative flow cytometric analysis of progenitor B (B220+IgM), immature B (B220loIgM+) and mature recirculating B cells (B220hiIgM+) in the bone marrow cavity. Numbers indicate the percentages of IgM- and B220-expressing cells of total lymphocytes. (B) Frequencies (left) and total numbers of pro–/pre–B cells (B220+IgM), immature B cells (B220loIgM+), and mature recirculating B cells (B220hiIgM+) defined as in A are shown (n = 11). (C) Frequencies (left) and numbers (right) of mature recirculating B (mature rec. B) cells (CD19+CD23+IgD+) in peripheral lymph nodes are shown (n = 11). (D) Frequencies (left) and numbers (right) of T1 B cells (CD19+CD21CD23), MZ (CD19+CD21+CD23lo), and follicular B cells (FO) CD19+CD21loCD23+) in spleens are shown (n = 11). In BD, bars and circles indicate averages and values for individual mice, respectively.
Figure 4
Figure 4. Plasma S1P concentration is reduced in Spns2–/– mice.
(AH) Plasma concentrations of S1P (A), sphingosine (SPH) (B), LPA (C), LPC (D), LPG (E), LPI (F), LPE (G), and LPS (H) in control (Spns2+/+) or Spns2–/– mice. Data are shown as mean ± SD (n = 3–5).
Figure 5
Figure 5. Spns2 is not involved in S1P release from blood cells.
(A) Release of S1P by the blood cells isolated from control (Spns2+/+) and Spns2–/– mice. Cells were incubated at either 4°C or at 37°C for 90 minutes as indicated at the bottom. Data are expressed as a percentage of the total amount of S1P in the cells without incubation and shown as mean ± SD (n = 4). (BD) Spns2–/– mice were lethally irradiated and reconstituted with bone marrow from littermate control mice. (B) Plasma S1P concentrations of either Spns2–/– mice (Pre) or of those reconstituted with WT bone marrow (Post) (n = 13). (C and D) Flow cytometric analyses of control (Spns2+/+) and Spns2–/– mice reconstituted with littermate control bone marrow (BM chimera). (C) Frequencies (left) and total numbers (right) of CD4 SP (CD4) and CD8 SP (CD8) T cells in the thymus are shown (Spns2+/+, n = 8; BM chimera, n = 13). (D) Frequencies (left) and total numbers of mature recirculating B cells (CD19+IgM+IgD+) in the bone marrow are shown (Spns2+/+, n = 8; BM chimera, n = 13).
Figure 6
Figure 6. Spns2 is involved in S1P release from ECs.
(A) Expression of Spns2 in ECs. RT-PCR analysis was performed to examine the expression of Spns2 in HUVECs, HMVECs, HAECs, HDLECs, HeLa, and HEK293 cells as indicated at the top. PCR was performed using specific primers for either Spns2 (upper panel) or GAPDH (lower panel). To verify the absence of contaminating genomic DNA, RT-PCR was also performed in the absence of reverse transcriptase (–). (B and C) S1P release from Spns2-depleted ECs. (B) Release of S1P by ECs transfected without (–) or with either control siRNA (control) or 2 independent siRNAs targeting Spns2 (Spns2#1 and Spns2#2). (C) Real-time RT-PCR analysis to assess the efficiency of siRNA-mediated Spns2 knockdown. In B and C, data are expressed relative to those observed in the untransfected cells and shown as mean ± SD of 3 independent experiments. (D) In situ hybridization for Spns2 mRNA in thymus. Antisense probe was hybridized to thymus section (Spns2: purple). Serial sections were also stained with anti-CD31 (CD31: brown) and anti–α-SMA (brown) antibodies to identify ECs and pericytes, respectively. The boxed areas of upper panels are enlarged in lower panels. Arrows and white arrowheads indicate ECs and pericytes, respectively. Scale bars: 50 μm (upper panels); 10 μm (lower panels).
Figure 7
Figure 7. Spns2 expressed in ECs is required for mature T cell egress from thymus.
(AC) Flow cytometric analyses of lymphocytes of control (Spns2f/f) or Spns2-ECKO (Spns2f/f;Tie2Cre) mice. (A) Frequencies (left) and numbers (right) of CD4/CD8 DN (DN), CD4/CD8 DP (DP), CD4 SP (CD4), and CD8 SP (CD8) thymocytes and T cells in thymus are shown (n = 11). (B) Frequencies and numbers of CD4 SP (CD4) and CD8 SP (CD8) T cells in peripheral lymph nodes are shown (n = 11). (C) Frequencies and numbers of CD4 SP (CD4) and CD8 SP (CD8) T cells in spleens are shown (n = 11). In AC, bars and circles indicate averages and values for individual mice, respectively.
Figure 8
Figure 8. Spns2 expressed in ECs is required for immature B cell egress from bone marrow.
(AC) Flow cytometric analyses of lymphocytes of control (Spns2f/f) or Spns2-ECKO (Spns2f/f;Tie2Cre) mice. (A) Frequencies (left) and numbers (right) of pro–/pre–B cells (B220+IgM), immature B cells (B220loIgM+), and mature recirculating B cells (B220hiIgM+) in bone marrow are shown (n = 11). (B) Frequencies (left) and numbers (right) of mature recirculating B (Mature rec. B) cells (CD19+CD23+IgD+) in peripheral blood are shown (n = 11). (C) Frequencies (left) and numbers (right) of T1 and B1 B cells (T1+B1), MZ, and follicular B cells in spleens are shown (n = 11). T1 and B1 B cells, MZ B cells, and follicular B cells were phenotypically defined as described in the legend of Figure 3D. In AC, bars and circles indicate averages and values for individual mice, respectively.

Similar articles

Cited by

References

    1. Chi H. Sphingosine-1-phosphate and immune regulation: trafficking and beyond. Trends Pharmacol Sci. 2011;32(1):16–24. doi: 10.1016/j.tips.2010.11.002. - DOI - PMC - PubMed
    1. Cyster JG. Chemokines, sphingosine-1-phosphate, and cell migration in secondary lymphoid organs. Annu Rev Immunol. 2005;23:127–159. doi: 10.1146/annurev.immunol.23.021704.115628. - DOI - PubMed
    1. Hla T. Physiological and pathological actions of sphingosine 1-phosphate. Semin Cell Dev Biol. 2004;15(5):513–520. doi: 10.1016/j.semcdb.2004.05.002. - DOI - PubMed
    1. Rivera J, Proia RL, Olivera A. The alliance of sphingosine-1-phosphate and its receptors in immunity. Nat Rev Immunol. 2008;8(10):753–763. - PMC - PubMed
    1. Spiegel S, Milstien S. The outs and the ins of sphingosine-1-phosphate in immunity. Nat Rev Immunol. 2011;11(6):403–415. doi: 10.1038/nri2974. - DOI - PMC - PubMed

Publication types

MeSH terms