. 2012 Apr;122(4):1487-502.
doi: 10.1172/JCI58092. Epub 2012 Mar 12.

EBNA3B-deficient EBV promotes B cell lymphomagenesis in humanized mice and is found in human tumors

Affiliations

EBNA3B-deficient EBV promotes B cell lymphomagenesis in humanized mice and is found in human tumors

Robert E White et al. J Clin Invest. 2012 Apr.

Abstract

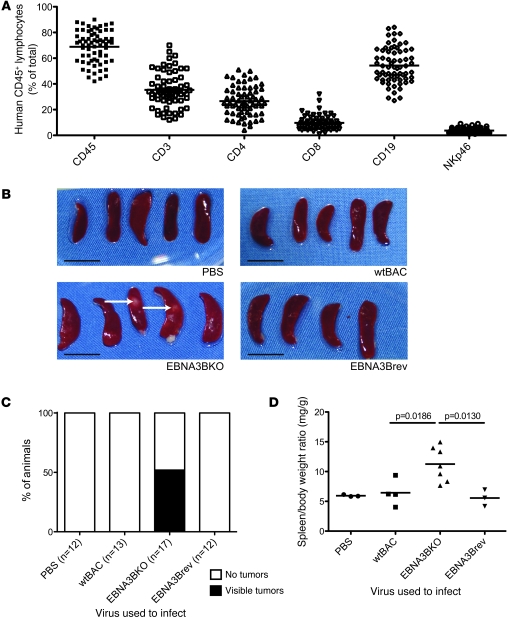
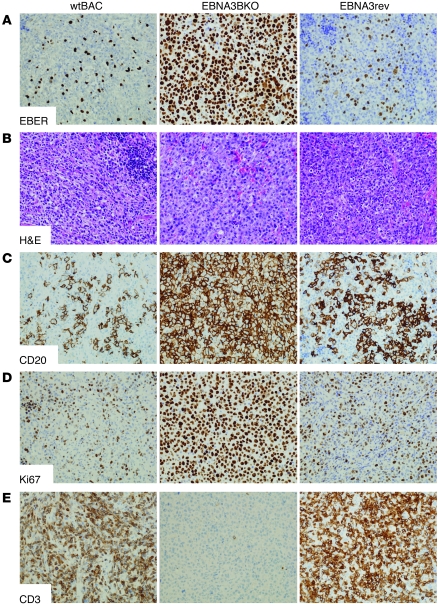
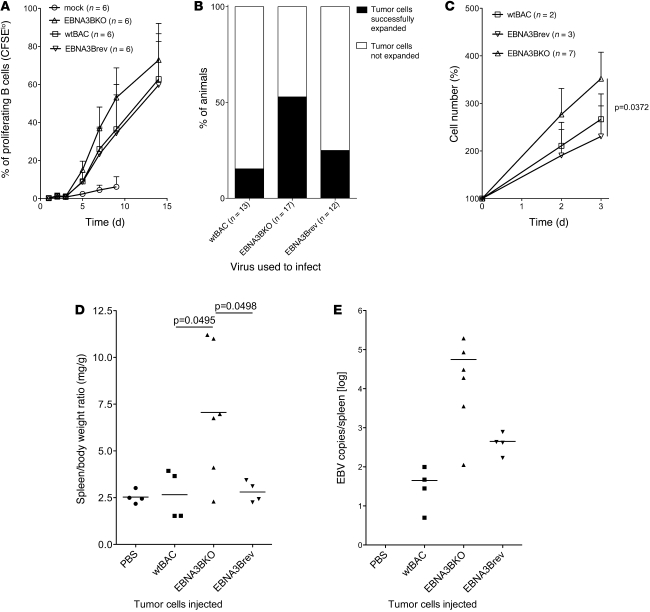
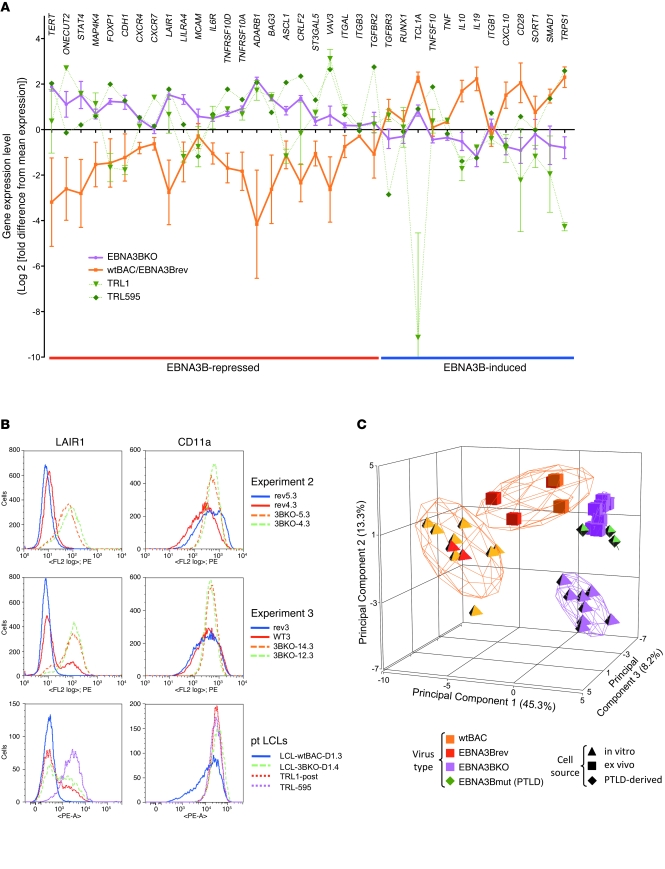
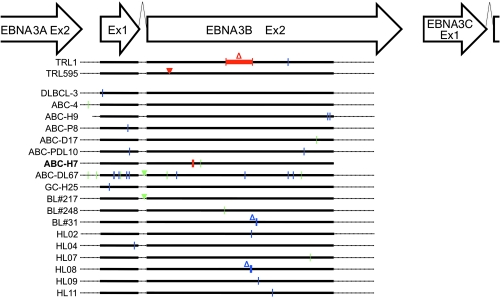
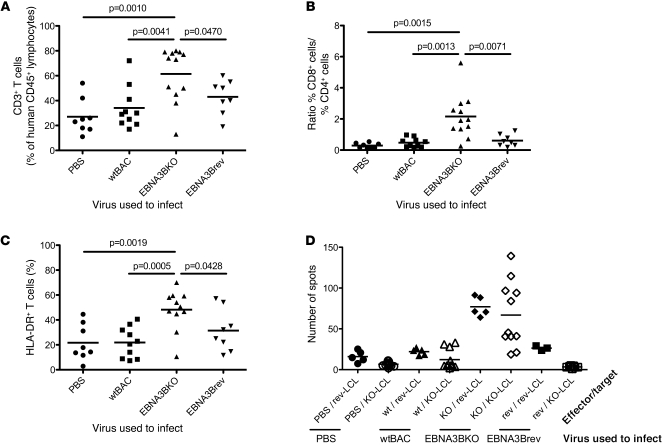
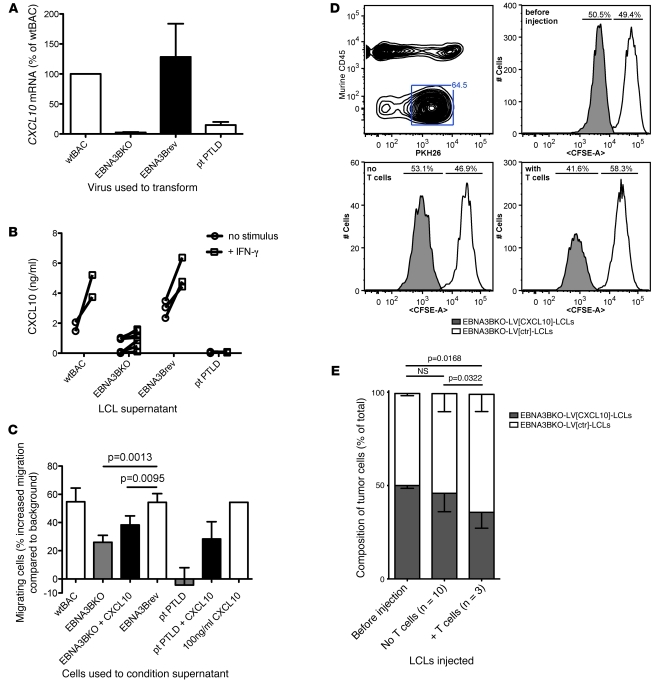
Epstein-Barr virus (EBV) persistently infects more than 90% of the human population and is etiologically linked to several B cell malignancies, including Burkitt lymphoma (BL), Hodgkin lymphoma (HL), and diffuse large B cell lymphoma (DLBCL). Despite its growth transforming properties, most immune-competent individuals control EBV infection throughout their lives. EBV encodes various oncogenes, and of the 6 latency-associated EBV-encoded nuclear antigens, only EBNA3B is completely dispensable for B cell transformation in vitro. Here, we report that infection with EBV lacking EBNA3B leads to aggressive, immune-evading monomorphic DLBCL-like tumors in NOD/SCID/γc-/- mice with reconstituted human immune system components. Infection with EBNA3B-knockout EBV (EBNA3BKO) induced expansion of EBV-specific T cells that failed to infiltrate the tumors. EBNA3BKO-infected B cells expanded more rapidly and secreted less T cell-chemoattractant CXCL10, reducing T cell recruitment in vitro and T cell-mediated killing in vivo. B cell lines from 2 EBV-positive human lymphomas encoding truncated EBNA3B exhibited gene expression profiles and phenotypic characteristics similar to those of tumor-derived lines from the humanized mice, including reduced CXCL10 secretion. Screening EBV-positive DLBCL, HL, and BL human samples identified additional EBNA3B mutations. Thus, EBNA3B is a virus-encoded tumor suppressor whose inactivation promotes immune evasion and virus-driven lymphomagenesis.


Figures

Figure 1
Figure 1. EBNA3BKO infection of mice with reconstituted human immune system components leads to splenomegaly and tumor formation.
(A) Reconstitution levels of human lymphocytes in mice used to study in vivo biology of EBNA3BKO (n = 66). Frequencies of human lymphocytes in peripheral blood of mice were determined by flow cytometry. Reconstitution levels for each animal are provided in Supplemental Table 1. (B) Macroscopically visible tumors (arrows) in spleens of animals 28 days after infection with PBS, wtBAC, EBNA3Brev, or EBNA3BKO by i.p. injection. Scale bars: 1 cm. (C) Frequency of overt tumor formation 28 days after infection. (D) Spleen/body weight ratio 28 days after infection. Data points represent individual mice; horizontal bars represent means. Shown is 1 representative of 3 experiments (B and D) or pooled data from 3 experiments (C).
Figure 2
Figure 2. Histological and immunohistochemical features of splenic lesions in EBNA3BKO-, EBNA3Brev-, and wtBAC-infected mice.
Shown are H&E and immunohistochemical sections from representative spleens of wtBAC- and EBNA3Brev-infected mice compared with a tumor from an EBNA3BKO-infected mouse. Original magnification, ×200. (A) EBER-1 in situ hybridization, showing EBV-positive cells. (B) H&E images showing monomorphic expansion of sheets of large lymphoid cells in the EBNA3BKO tumor — distinct from the polymorphic cellular composition of the splenic lesions (wtBAC and EBNA3Brev) — composed of a mix of lymphoid cells of varying sizes, plasma cells, and histiocytes. (C) Immunostaining for B cells (CD20). Nearly 100% of the cells in the EBNA3BKO-induced tumor were large B cells, whereas B cells of varying sizes represent approximately 40% of the cells in wtBAC- and EBNA3Brev-infected spleens. (D) Immunostaining for cell proliferation (Ki67). More than 95% of cells in the EBNA3BKO-induced tumor proliferated, versus approximately 40% in wtBAC- and EBNA3Brev-infected spleens. (E) Immunostaining for T cells (CD3). Only sparse infiltrating T cells were observed in the EBNA3BKO-induced tumor, whereas at least 50% of the cells in wtBAC- and EBNA3Brev-infected splenic lesions were T cells.
Figure 3
Figure 3. Transformation of B cells in vitro using EBNA3BKO is more efficient, and ex vivo–expanded tumor cells lacking EBNA3B show enhanced tumorigenicity, in unreconstituted NSG mice.
(A) CFSE-labeled PBMCs from healthy donors were infected with EBV (2.5 × 10⁴ RGU per 106 PBMCs). CFSE dilution as a surrogate of proliferation was measured over a period of 14 days. Pooled data from 6 healthy donors are shown. 2 LCLs from each of the 6 donors were assessed at the indicated time points. Data are mean ± SD. (B) Frequency of successful outgrowth of NSG-LCLs from spleens of animals infected with 104 RGU of EBV. Pooled data from 3 experiments are shown. (C) Growth behavior of NSG-LCLs was assessed longitudinally. 5 × 10⁵ NSG-LCLs/ml were seeded, and cell numbers were determined at the indicated times. Data are mean ± SD. (D) 20 days after i.p. injection of 107 ex vivo–expanded tumor cells into immunodeficient NSG mice, spleens were weighed relative to total animal mass to assess splenomegaly. 1 representative of 2 experiments is shown. Statistical significance was assessed using unpaired Student’s t test. (E) Splenic DNA from animals injected with EBV-transformed tumor cells was isolated 20 days after injection, and EBV DNA load was determined by qPCR. 1 representative of 2 experiments is shown. (D and E) Data points represent individual mice; horizontal bars represent means.
Figure 4
Figure 4. PTLD-derived LCLs lacking EBNA3B phenotypically resemble those derived from infected mice.
(A) Relative gene expression levels, measured by qPCR using Taqman low-density arrays, normalized against 4 endogenous controls, and plotted on a log2 scale as the distance from the geometric mean expression for that gene across all cell lines. Data are mean ± SEM for the EBNA3BKO and combined wtBAC and EBNA3Brev cell lines. Also shown are expression levels in the patient-derived cell lines, for which error bars indicate expression values of the 2 TRL1 lines. Data points are connected to clarify data trends. (B) Flow cytometry profiles for LAIR1 and CD11a expression in ex vivo–expanded cells from 2 mouse experiments and EBNA3B mutant PTLD patients (ptLCLs). Each plot contains the same number of gated events to facilitate comparison of samples within the same experiment. (C) Principal component correlation analysis of cell lines based on gene expression data from qPCR analysis of the 48 genes shown in Supplemental Figure 3. Samples are identified by the infecting virus (color) and whether the LCLs were established in vitro or ex vivo (shape). Groups by virus and LCL type are indicated by overlaid icosahedrons colored by virus type; wtBAC and EBNA3Brev were considered as a single group, and TRL1 and TRL595 lines were separated. Percent contribution of each principal component to total variation is indicated on the respective axis.
Figure 5
Figure 5. EBNA3B mutations identified in lymphomas.
Schematic representation (to scale) of the EBNA3B gene locus (flanked by EBNA3A and EBNA3C as indicated) and, below, visual representation of definite and potential EBNA3B mutations (i.e., tumor-only polymorphisms) identified by comparing 39 lymphoma samples with 69 sLCLs. Only those samples with at least 1 possible mutation are shown. Bold horizontal lines indicate the coding region analyzed for mutations (amino acids 1–700). Dashed horizontal lines indicate the extent of sequence used in the sequence alignment (see Supplemental Data File 1). EBNA3B mutations identified in LCLs grown from PTLD tumors (i.e., TRL1 and TRL595) are shown for comparison. Red symbols, mutations leading to a premature STOP codon; blue symbols, potential missense mutations; green symbols, DNA changes that do not alter protein sequence. Vertical lines represent substitution mutants/polymorphisms; inverted triangles indicate insertional mutations; and deletion mutants are shown by open triangles, with the associated box indicating the deletion size. Sample ABC-H7 (bold) contains a truncation mutation (GGA to TGA substitution mutant at codon 263) positioned between the 2 previously described TRL mutants. See Table 1 for details of these mutations and characteristics of all tumors analyzed.
Figure 6
Figure 6. Infection with EBNA3BKO primes stronger immune responses than infection with wtBAC or EBNA3Brev.
Splenocytes from control or EBV-infected animals were isolated 28 days after infection. (A) CD3+ T cell frequency among human CD45+ lymphocytes, determined by flow cytometry. (B) Ratio of CD8+ T cell to CD4+ T cell frequency. (C) Activation of T cells, assessed by HLA-DR expression on their surface. (D) Isolated splenocytes were depleted of human B cells and cocultured with ex vivo–expanded tumor cell lines to measure EBV-specific IFN-γ secretion, determined using ELISPOT assays and expressed as the number of IFN-γ–specific spots per 2 × 10⁵ cells. Pooled data from 2 experiments are shown. (AD) Data points represent individual mice; horizontal bars represent means.
Figure 7
Figure 7. EBNA3BKO-transformed tumor cells produce and secrete reduced amounts of CXCL10 and attract fewer EBV-specific T cells.
(A) CXCL10 mRNA levels, determined by qPCR, normalized to GAPDH expression, and expressed relative to CXCL10 expression of wtBAC-transformed tumor cells. (B) CXCL10 protein levels, determined in culture supernatants of EBV-transformed tumor cells by ELISA after 24 hours of culture with or without added IFN-γ. (C) Migration of the EBV-specific CD8+ T cell clone MS.B11 toward tumor cell–conditioned supernatants, assessed by Transwell migration assay. For EBNA3BKO-transformed tumor lines and patient PTLD LCLs, CXCL10 was supplemented as indicated to reach concentrations present in wtBAC- and EBNA3Brev-conditioned supernatants. (AC) Shown is 1 representative of 2 experiments with 2 wtBAC, 3 EBNA3Brev, 7 EBNA3BKO, and 2 patient PTLD LCLs (TRL1-post and TRL595). (D and E) Killing of CXCL10-reexpressing EBNA3BKO LCLs by an autologous T cells line was tested in vivo. LCLs were transduced with a CXCL10-expressing lentivirus or control virus. In vivo killing assays were performed after labeling of LCLs with PKH26 and high or low concentration of CFSE. (D) Example of FACS gating for the experiment, and representative histograms for tumor cell composition before and after injection in the presence or absence of autologous T cells. Percentages denote CXCL10+ and CXCL10 cells as a fraction of total tumor cells. (E) Summary of 3 experiments performed as described in D. (AE) Data are mean ± SD.

Similar articles

Cited by

References

    1. Young LS, Rickinson AB. Epstein-Barr virus:40 years on. Nat Rev Cancer. 2004;4(10):757–768. doi: 10.1038/nrc1452. - DOI - PubMed
    1. Cohen JI, Fauci AS, Varmus H, Nabel GJ. Epstein-barr virus: an important vaccine target for cancer prevention. Sci Transl Med. 2011;3(107):107fs7. doi: 10.1126/scitranslmed.3002878. - DOI - PMC - PubMed
    1. Thorley-Lawson DA. Epstein-Barr virus: exploiting the immune system. Nat Rev Immunol. 2001;1(1):75–82. doi: 10.1038/35095584. - DOI - PubMed
    1. Küppers R. B cells under influence: transformation of B cells by Epstein-Barr virus. Nat Rev Immunol. 2003;3(10):801–812. - PubMed
    1. White RE, Groves IJ, Turro E, Yee J, Kremmer E, Allday MJ. Extensive Co-Operation between the Epstein-Barr Virus EBNA3 Proteins in the Manipulation of Host Gene Expression and Epigenetic Chromatin Modification. PLoS ONE. 2010;5(11):e13979. doi: 10.1371/journal.pone.0013979. - DOI - PMC - PubMed

Publication types

MeSH terms