. 2012 Mar 11;44(4):406-12, S1.
doi: 10.1038/ng.2215.

Generation of functional insulin-producing cells in the gut by Foxo1 ablation

Affiliations

Generation of functional insulin-producing cells in the gut by Foxo1 ablation

Chutima Talchai et al. Nat Genet. .

Abstract

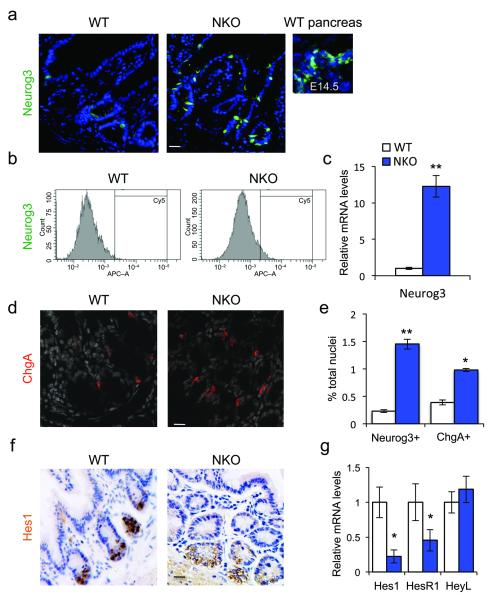
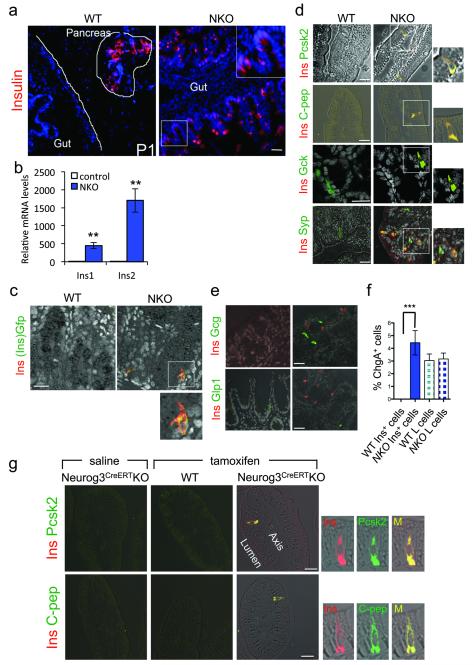
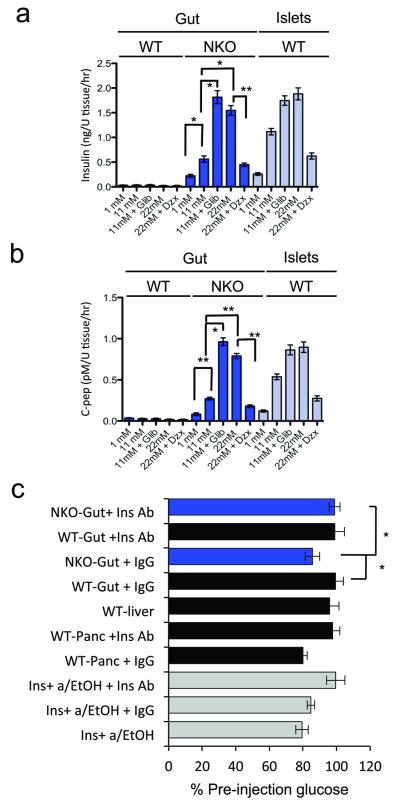
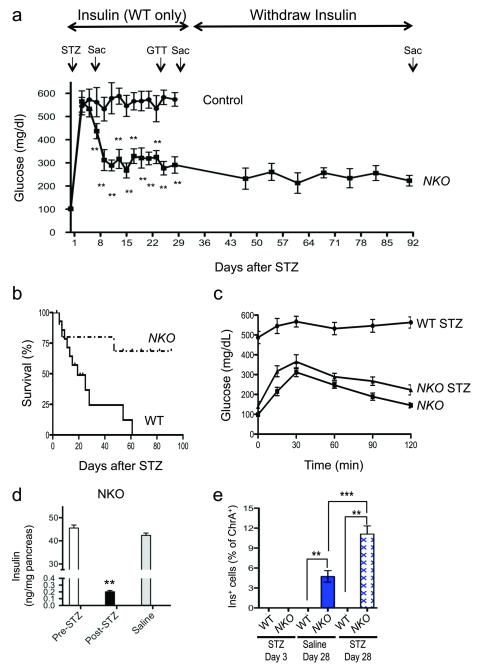
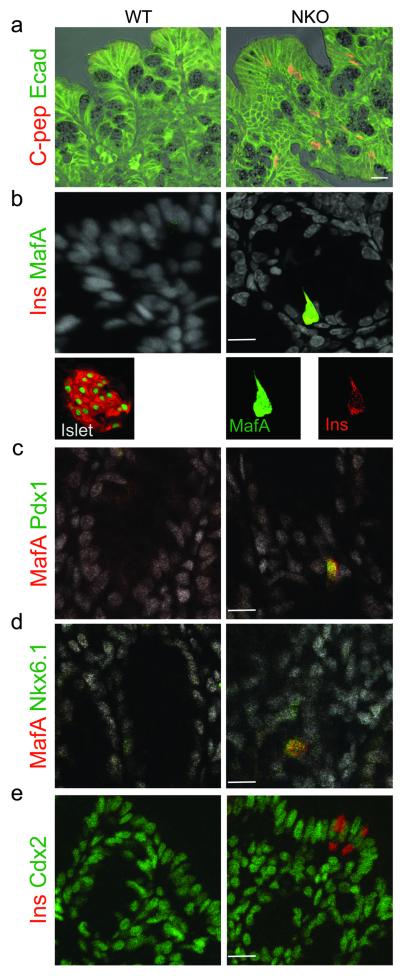
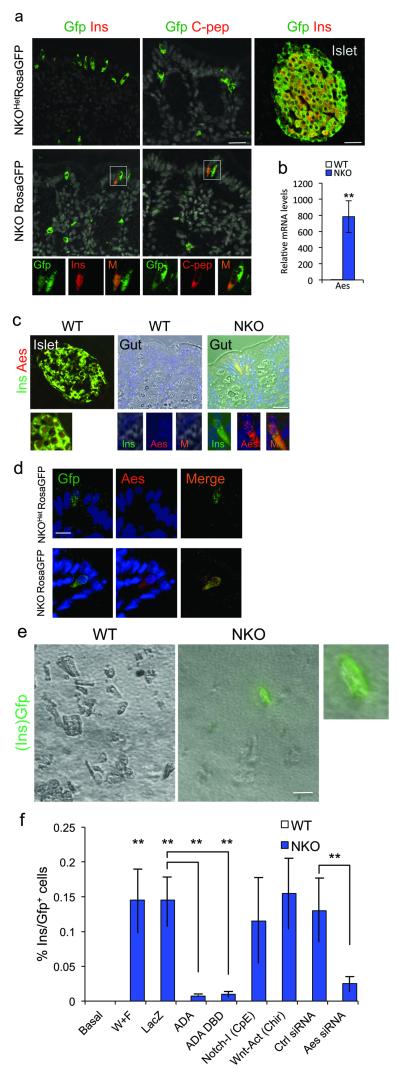
Restoration of regulated insulin secretion is the ultimate goal of therapy for type 1 diabetes. Here, we show that, unexpectedly, somatic ablation of Foxo1 in Neurog3(+) enteroendocrine progenitor cells gives rise to gut insulin-positive (Ins(+)) cells that express markers of mature β cells and secrete bioactive insulin as well as C-peptide in response to glucose and sulfonylureas. Lineage tracing experiments showed that gut Ins(+) cells arise cell autonomously from Foxo1-deficient cells. Inducible Foxo1 ablation in adult mice also resulted in the generation of gut Ins(+) cells. Following ablation by the β-cell toxin streptozotocin, gut Ins(+) cells regenerate and produce insulin, reversing hyperglycemia in mice. The data indicate that Neurog3(+) enteroendocrine progenitors require active Foxo1 to prevent differentiation into Ins(+) cells. Foxo1 ablation in gut epithelium may provide an approach to restore insulin production in type 1 diabetes.


Figures

Figure 1
Figure 1
Foxo1 ablation in enteroendocrine progenitors expands the pool of Neurog3+ cells. (a) Neurog3 immunohistochemistry (green) in small intestines of adult WT or NKO mice or in pancreas from developmental day E14.5. (b) Flow cytometry profiles of gut epithelial cell preparations isolated from WT or NKO mice. (c) qPCR analysis of Neurog3 expression in isolated epithelial cells from small and large intestines of NKO (blue bars) or control (white bars) mice. (d) ChgA immunostaining (red) in adult large intestines. (e) Hes1 immunoreactivity (brown) in adult large intestines. (f) Quantification of gut cells reactive with antibodies to Neurog3 or ChgA, a pan-endocrine marker, by flow cytometry analysis. (g) qPCR analysis of Hes1, HesR1, and HeyL expression in isolated epithelial cells from small and large adult intestines. Scale bars: 40 μm (a, f), 30 μm (d), (n = 3 for histology n=4 for flow cytometry, and n = 8 for qPCR). * = P < 0.05, ** = P < 0.01. Error bars indicate SEM.
Figure 2
Figure 2
Gut insulin–producing cells in NKO mice. (a) Insulin immunohistochemistry (red) in pancreas (outlined) and small intestine of 1-day-old mice. (b) qPCR analysis of Ins1 and Ins2 expression in isolated epithelial cells from DTZ-enriched gut fragments in NKO mice (blue bars) and anatomically matched segments in control mice (white bars). (c) Immunofluorescence with insulin (red) and Gfp (green) in NKO:Ins2-Gfp mice. (d) Co-localization of insulin (red) and the following markers: Prohormone convertase 2 (Pcsk2), C-peptide, Glucokinase (Gck), and Synaptophysin (Syp) (all in green) in adult intestines. (e) Immunostaining with insulin (red), and glucagon (Gcg), or glucagon-like peptide-1 (Glp1) (green). (f) Morphometric analysis of gut Ins+ and L cells from distal ileum and colon in 3-month-old mice normalized by total number of ChgA+ cells. Error bars indicate SEM. (g) Tamoxifen-induced Foxo1 deletion in adult mice with Neurog3-CreERT. Panels show co-immunolocalization of insulin (red) with either Pcsk2 or C-peptide (green), two weeks after saline (left panels) or tamoxifen (TM) injection (middle and right panels) in 10-wk-old Neurog3CreERTKO and controls. Scale bars: 100 μm (a), 40 μm (e), and 30 μm (c-d, g) (n = 3 for histology and n = 8 for qPCR). * = P < 0.05, ** = P < 0.01, *** = P < 0.001.
Figure 3
Figure 3
Insulin secretion and bioactivity. (a, b) Glucose-dependent insulin and C-peptide secretion from NKO (blue bars) and control gut or islets (gray bars) of adult mice incubated with the indicated concentrations of glucose and 0.5 mM diazoxide (Dzx), or 10 nM Glibenclamide (Glib) (n = 4). U tissue corresponds to 1-inch of gut or one islet. (c) Effects of acid-ethanol extracts from NKO (blue bars) or control mice (gray bars) on glucose levels following subcutaneous injections in 5-day-old mice. Samples were pre-incubated with anti-insulin neutralizing antibody (Ins Ab), or isotype-matched control IgG (IgG). Recombinant human insulin (2U per kg body weight) was subjected to acid-ethanol precipitation prior to injection (acid/EtOH) (n = 8 in a-b, and n = 12 in c). 3 independent experiments were performed for secretion assays and 2 for bioassay. * = P < 0.05, ** = P < 0.01. Error bars indicate SEM.
Figure 4
Figure 4
Regeneration of gut Ins+ cells following STZ-mediated ablation. (a) Fed glucose levels in NKO (squares) and control mice (circles). Arrows indicate timing of STZ administration (STZ) and killing (SAC). Insulin (2-4 U/kg/day) was administered to control mice from day 3 to day 28 (n = 16). (b) Survival plots of NKO and WT mice following STZ. (c) Oral glucose tolerance tests in NKO mice before and after STZ administration (day 20), and in WT controls following STZ (day 20). (d) Pancreatic insulin content of NKO mice pre- or post-STZ (black bar), or saline injection (n = 4). (e) Quantification of gut Ins+ cells in WT and NKO mice at day 3 and day 28 post-injection, in animals treated with saline (blue bar), or STZ (hatched pattern). * = P < 0.05, ** = P < 0.01, *** = P < 0.001. Error bars indicate SEM.
Figure 5
Figure 5
Marker analysis of gut Ins+ cells. (a) Immunohistochemical co-localization of E-cadherin (green) and C-peptide (red). (b) Co-localization of β-cell transcription factor MafA (red) with insulin (green) in gut and islets. In the gut, the antigen retrieval procedure for co-immunostaining leads to cytoplasmic bleed-through of MafA immunoreactivity. (c-d) Co-localization of MafA (red) with β-cell transcription factors Pdx1 or Nkx6.1 (green). (e) Co-localization of insulin (red) with Cdx2 (green). Images were taken from colon and distal ileum of adult NKO and WT mice. Scale bars: 30 μm (a-e) n=4.
Figure 6
Figure 6
Lineage tracing of Ins+ cells and Aes expression. (a) Immunohistochemistry with Gfp (green) and insulin or C-peptide (red) in WT islets, WT gut, and NKO:Rosa26eGfp gut. Gfp+/Ins+ or Gfp+/C-peptide+ cells are indicated in rectangles. (b) qPCR of gut Aes mRNA sampled from gut segments enriched with Ins+ cells and anatomically matched specimens from WT controls (n=4). (c) Islet and gut immunohistochemistry with insulin (green) and Aes (red) in NKO and control mice. (d) Gut immunostaining with Gfp (green) and Aes (red) in NKO:Rosa26eGfp and WT mice. (e) Gfp direct fluorescence of primary gut cells isolated from NKO:Ins2-Gfp or Ins2-Gfp control mice and cultured in Wnt3a- and Fgf4-containing medium for 4 days. (f) Quantification of Ins2-Gfp cells in differentiation assays. With the exception of basal conditions, all treatments included Wnt3a and Fgf4 (W+F), and were further subjected to viral transduction (LacZ, Foxo1-ADA, or Foxo1-DBD-ADA), or Notch inhibitor (Compound E), or Wnt agonist (sc222416), or siRNA. No Gfp+ cells from Ins2-Gfp control mice were observed in any condition (white bars). Blue bars indicate counts of Gfp+ cells in cultures from NKO:Ins2-Gfp mice. Data indicate means ± SEM from 3 independent experiments. Scale bars: 40 μm (a, c), 30 μm (e), and 20 μm (d). * = P < 0.05, ** = P < 0.01.

Comment in

References

    1. Zhou Q, Melton DA. Pathways to new beta cells. Cold Spring Harb Symp Quant Biol. 2008;73:175–81. - PubMed
    1. Kroon E, et al. Pancreatic endoderm derived from human embryonic stem cells generates glucose-responsive insulin-secreting cells in vivo. Nat Biotechnol. 2008;26:443–52. - PubMed
    1. Bonal C, Herrera PL. Genes controlling pancreas ontogeny. Int J Dev Biol. 2008;52:823–35. - PubMed
    1. Gradwohl G, Dierich A, LeMeur M, Guillemot F. neurogenin3 is required for the development of the four endocrine cell lineages of the pancreas. Proc Natl Acad Sci U S A. 2000;97:1607–1611. - PMC - PubMed
    1. Jensen J, et al. Control of endodermal endocrine development by Hes-1. Nat Genet. 2000;24:36–44. - PubMed

Publication types

MeSH terms