. 2012 Mar 11;18(4):580-8.
doi: 10.1038/nm.2685.

A systems approach identifies HIPK2 as a key regulator of kidney fibrosis

Affiliations

A systems approach identifies HIPK2 as a key regulator of kidney fibrosis

Yuanmeng Jin et al. Nat Med. .

Erratum in

Abstract

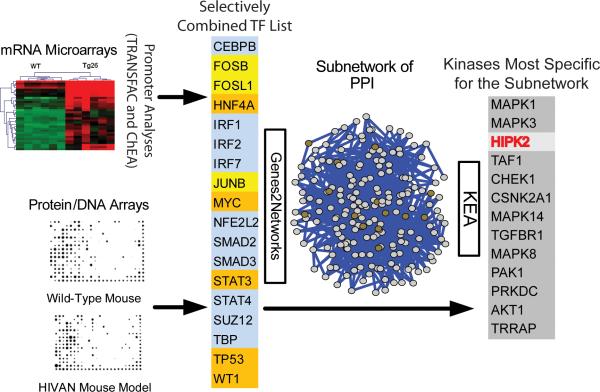
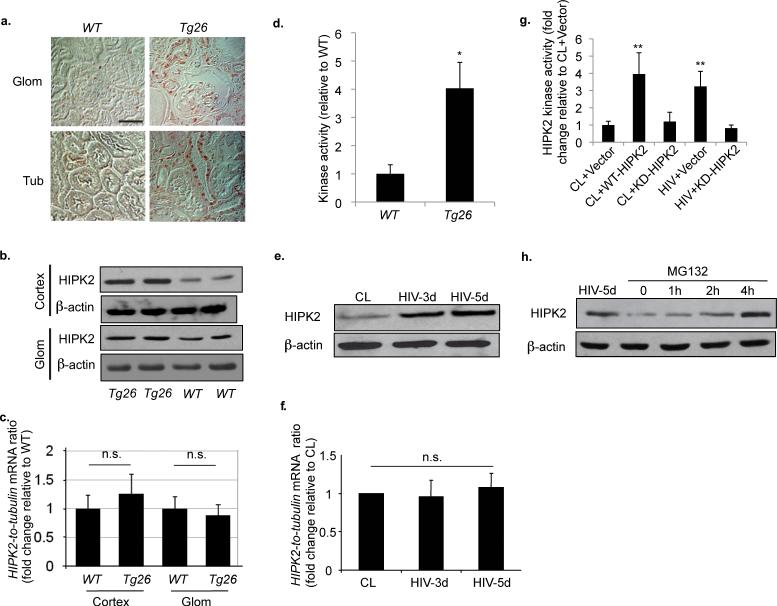
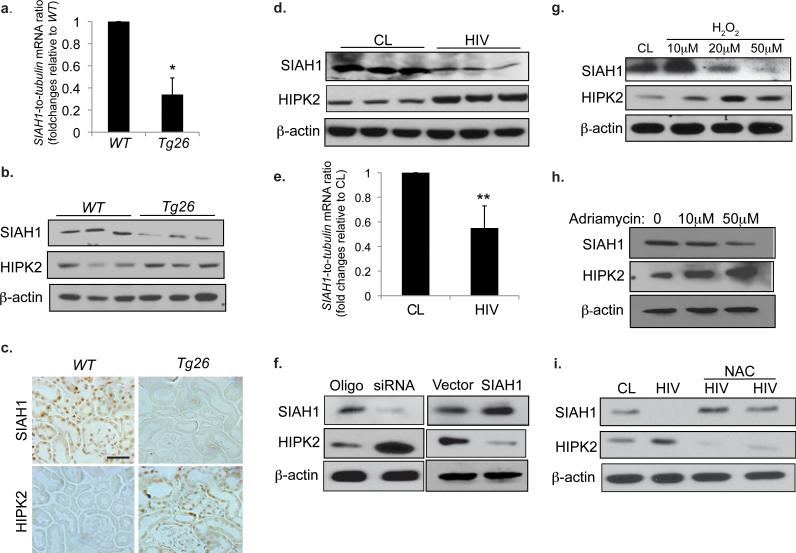
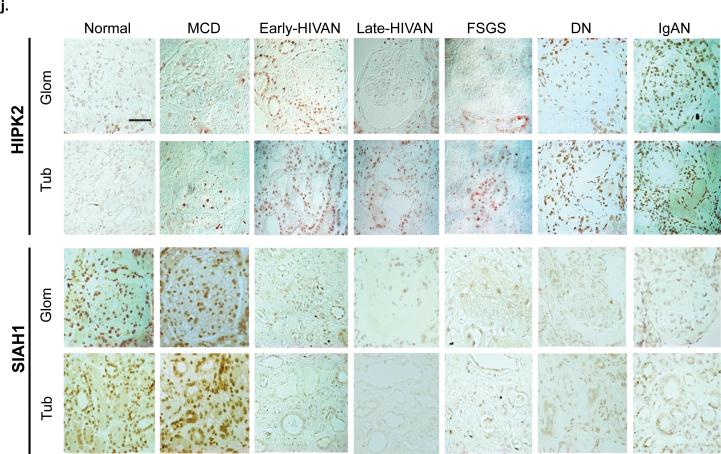
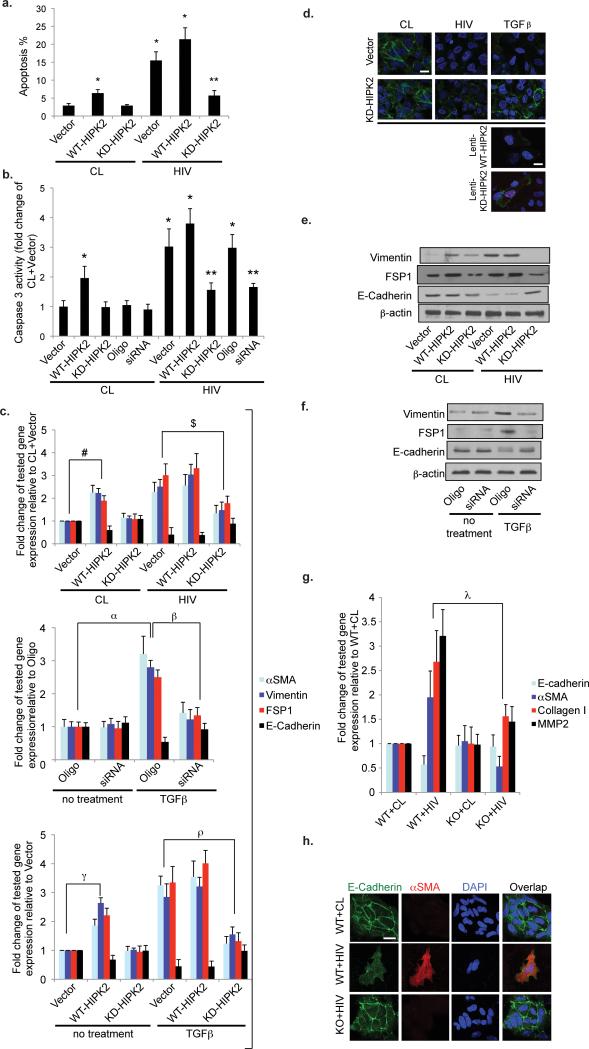
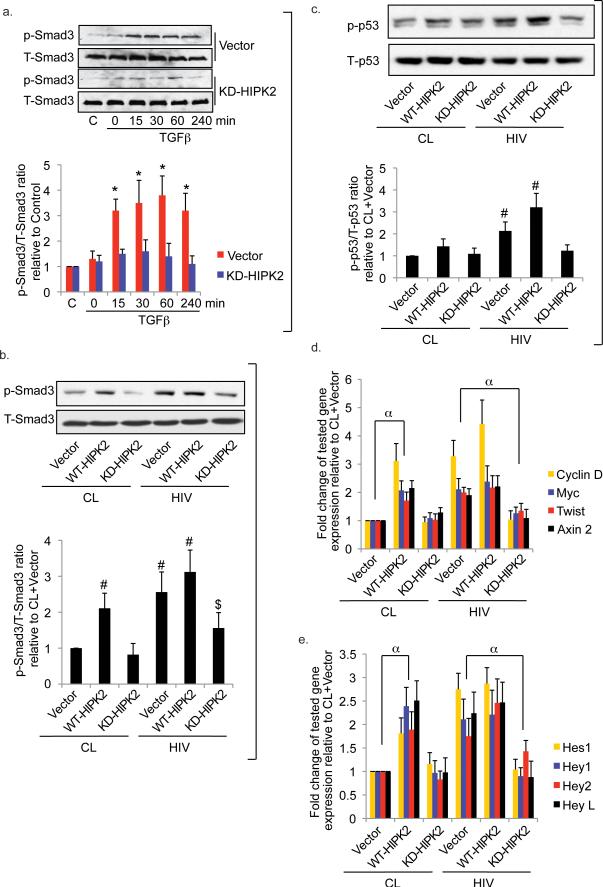
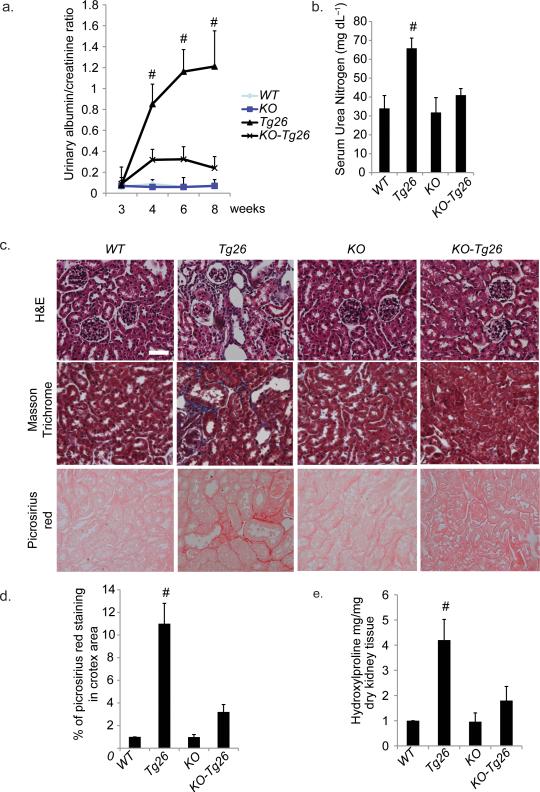
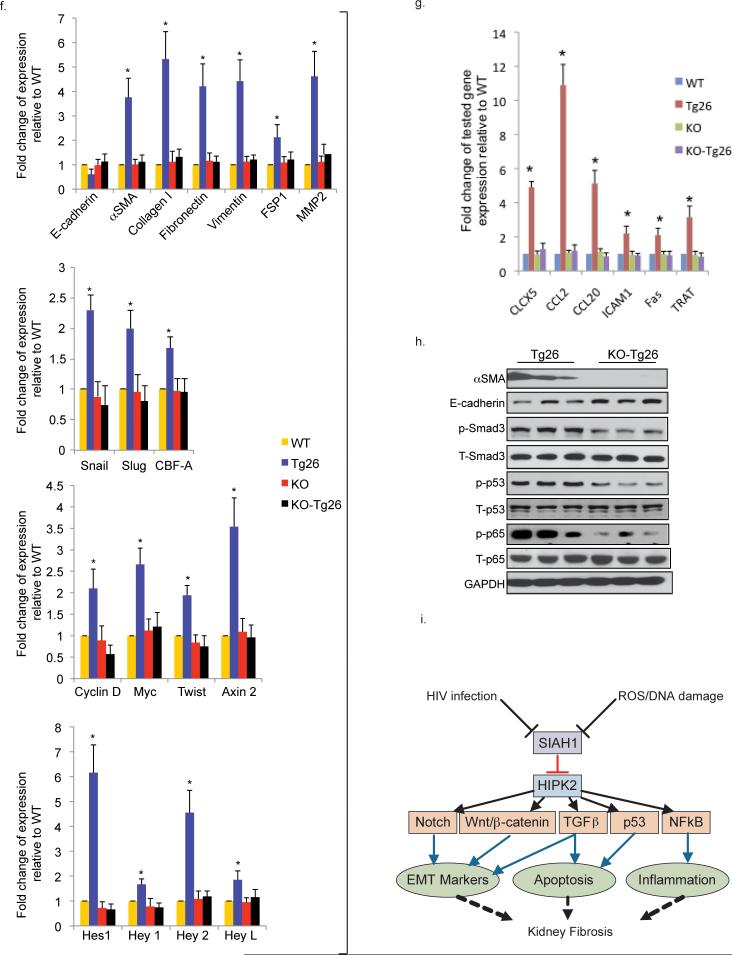
Kidney fibrosis is a common process that leads to the progression of various types of kidney disease. We used an integrated computational and experimental systems biology approach to identify protein kinases that regulate gene expression changes in the kidneys of human immunodeficiency virus (HIV) transgenic mice (Tg26 mice), which have both tubulointerstitial fibrosis and glomerulosclerosis. We identified homeo-domain interacting protein kinase 2 (HIPK2) as a key regulator of kidney fibrosis. HIPK2 was upregulated in the kidneys of Tg26 mice and in those of patients with various kidney diseases. HIV infection increased the protein concentrations of HIPK2 by promoting oxidative stress, which inhibited the seven in absentia homolog 1 (SIAH1)-mediated proteasomal degradation of HIPK2. HIPK2 induced apoptosis and the expression of epithelial-to-mesenchymal transition markers in kidney epithelial cells by activating the p53, transforming growth factor β (TGF-β)-SMAD family member 3 (Smad3) and Wnt-Notch pathways. Knockout of HIPK2 improved renal function and attenuated proteinuria and kidney fibrosis in Tg26 mice, as well as in other murine models of kidney fibrosis. We therefore conclude that HIPK2 is a potential target for anti-fibrosis therapy.


Figures

Figure 1
Figure 1. Identification of key signaling pathways activated in HIVAN
Two methods of computational promoter analysis (TRANSFAC and ChEA) and protein/DNA interaction array were used to identify eighteen transcription factors (TFs) differentially activated in kidneys of Tg26 mice. Top 5 TFs that are highly ranked in either of the promoter analyses are in blue (n=10); TFs that are in common between TRANSFAC and the protein/DNA interaction array are in yellow (n=3); TFs that are in common between ChEA and the protein/DNA interaction array are in orange (n=5). We generated a subnetwork of proteins that interact with this selectively combined list of 18 TFs using Genes2Networks. Proteins within the subnetwork (n=205) were used as inputs for Kinase Enrichment Analysis (KEA) to identify protein kinases that are likely responsible for the phosphorylation of proteins within the subnetwork. HIPK2 is the third most highly ranked kinase (red).
Figure 2
Figure 2. HIV induces HIPK2 expression in kidney cells
(a) Immunostaining of HIPK2 in kidneys from Tg26 mice and wild type (WT) littermates. n=5 for WT and Tg26. (b) Western blots of HIPK2 and β-actin in protein lysates from the kidney cortex (Cortex) and isolated glomeruli (Glom) of two Tg26 and two WT animals. (c) HIPK2 expression in Cortex and Glom samples from Tg26 and WT as analyzed by real-time PCR, n=5. (d) HIPK2 kinase activity in kidneys of Tg26 and WT mice, n=5, *p<0.001. Western blots (e) and real-time PCR (f) for HIPK2 in human renal tubular epithelial cells (hRTEC) infected with a control virus (CL) or a pseudotyped HIV-1 virus (HIV) for 3 and 5 days (HIV-3d and HIV-5d), n=4. (g) HIPK2 kinase activity in hRTEC infected with either CL or HIV and transfected with an empty expression vector (vector), a wild-type HIPK2 vector (WT-HIPK2) or a kinase dead HIPK2 vector (KD-HIPK2). n=4, p**<0.01 compared to CL+Vector. (h) Western of HIPK2 for hRTEC infected with HIV for 5 days (HIV-5d) or treated with MG132 for 0, 1, 2, and 4 hours. Representative blots of three independent experiments are shown for all western blots. Error bars represent s.d. Scale bar, 50μm. n.s. = not significant.
Figure 3
Figure 3. SIAH1 is an upstream regulator of HIPK2 expression
(a) Expression of SIAH1 in the renal cortex of WT and Tg26 mice as determined by real-time PCR, n=5. (b) Western blots of SIAH1, HIPK2 and β-actin in the kidney cortex of WT and Tg26 mice, n=3. (c) Immunostaining of SIAH1 and HIPK2 in adjacent kidney sections of Tg26 and WT mice. (d) Western blots of SIAH1, HIPK2, and β-actin in human renal tubular epithelial cells (hRTECs) infected with a control virus (CL) or a pseudotyped HIV-1 virus (HIV). (e) Expression of SIAH1 in hRTEC infected with CL or HIV as quantified by real-time PCR, n=4 (f) Western blots of SIAH-1, HIPK2, and β-actin in hRTEC transfected with a specific siRNA to knockdown SIAH1 (siRNA), a negative control siRNA oligo (Oligo), an empty expression vector (Vector), or a SIAH1 expression vector (SIAH1). Western blots of hRTECs cultured in the presence of H2O2 (0, 10, 20, 50 μM) for 24 hr (g), treated with adriamycin (0, 10, and 50μM) for 24 hr (h), or infected with CL or HIV and then cultured in the presence and absence of N-acetylcystein (NAC; 10mM) for 3 days (i). (j) Immunostaining of HIPK2 and SIAH1 in patients with minimal change disease (MCD), HIVAN (early and late stages), idiopathic focal segmental glomerulosclerosis (FSGS), diabetic nephropathy (DN), IgA nephropathy (IgAN), and normal nephrectomy samples (Normal). Representative fields of glomeruli (Glom) and tubules (Tub) are shown. Semi-quantitative scoring of staining results is summarized in Supplementary Table c. All error bars represent s.d. *p<0.01 compared to WT. **p<0.05 compared to CL. Scale bar, 50μm
Figure 4
Figure 4. HIPK2 mediates HIV-induced apoptosis and expression of EMT markers in human renal tubular epithelial cells (hRTEC)
(a) Apoptosis was measured by flowcytometry after labeling with Annexin V and propidium iodide in hRTEC infected with either a control virus (CL) or a HIV-1 pseudotyped virus (HIV) and then transfected with an empty expression vector (Vector), a wild-type HIPK2 vector (WT-HIPK2), or a kinase-dead HIPK2 vector (KD-HIPK2). (b) Caspase 3 activity of hRTEC infected with CL or HIV and then transfected with Vector, WT-HIPK2, KD-HIPK2, a negative control siRNA (Oligo), or a specific siRNA to knockdown HIPK2 (siRNA). n=4 for all groups. (c, upper panel) Expression of epithelial mesenchymal transition (EMT) markers in hRTEC infected with HIV or CL virus and then transfected with Vector, WT-HIPK2, or KD-HIPK2. Fold change in expression relative to the CL+Vector group is shown. n=4 for all groups. (c. middle panel) Gene expression of hRTEC transfected with Oligo or siRNA and then treated with or without TGFβ (5 ng/ml). n=4 for all groups. (c lower panel) Gene expression in hRTEC transfected with WT-HIPK2, KD-HIPK2 or Vector and then incubated with or without TGFβ (5 ng/ml). n=4 for all groups. Immunofluorescent staining of E-cadherin in hRTEC transfected with Vector or KD-HIPK2 and then infected with either CL or HIV or treated with TGFβ (d, two upper panels). Immunostaining of E-Cadherin in hRTECs transduced with lentivectors to overexpress a fusion protein of mCherry with WT-HIPK2 (Lenti-WT-HIPK2) or with KD-HIPK2 (Lenti-KD-HIPK2) and treated with TGFβ (d, lower panel). E-Cadherin is green, Nuclear staining with DAPI is blue, mCherry fusion proteins are magenta. Representative results are shown. Scale bar, 10μm. Western blots of hRTEC cultured in the same condition as Fig 4c, upper panel (e) and as Fig 4c, middle panel (f). Representative blots of three independent experiments are shown. (g) Expression of targeted genes in primary renal tubular cells isolated from HIPK2 knockout mice (KO) and their WT (WT) littermates were infected with CL or HIV for 3 days and then quantified by real-time PCR. n=4 for all groups. (h) Immunofluorescent staining of E-Cadherin, alphaSMA, and DAPI in primary RTEC isolated from WT mice and infected with CL or HIV or from KO mice infected with HIV. αSMA = alpha smooth muscle actin. Scale bar 10μm. FSP1 = fibroblast-specific protein 1. TGFβ = transforming growth factor-β. DAPI = 4',6-diamidino-2-phenylindole. * p<0.01 compared to CL+Vector. ** p<0.01 compared to HIV+Vector. For each of the tested genes, # p<0.01 CL+Vector vs. CL+WT-HIPK2; $ p<0.05 HIV+Vector vs. HIV+KD-HIPK2; α p<0.01 Oligo vs. Oligo+TGFβ; β p<0.05 Oligo+TGFβ vs. siRNA+TGFβ; γ p<0.01 Vector vs. WT-HIPK2; ρ p<0.05 TGFβ+Vector vs. TGFβ+ KD-HIPK2; λ p<0.01 WT+HIV vs. KO+HIV.
Figure 5
Figure 5. HIPK2 mediates downstream signaling pathways in RTEC
Western blots (a. upper panel) of phospho- and total Smad3 (p-Smad3 and T-Smad3) using nuclear lysate of HK2 cells transfected with either an empty expression vector (Vector) or a kinase dead HIPK2 (KD-HIPK2) expression vector and then stimulated with TGFβ (5 ng/ml) for 0, 15, 30, 60, or 240 min. (a. lower panel) Ratios of densitometric measurements of p-Smad3 to T-Smad3 band intensity. Western blots (b. upper panel) and densitometric ratios (b. lower panel) of p-Smad3 to T-Smad3 in HK2 infected with either a control (CL) virus or a HIV-1 pseudotyped virus (HIV) prior to transfection with an empty expression vector (Vector), a wild-type HIPK2 vector (WT), or a kinase-dead HIPK2 vector (KD). Western blots (c. upper panel) and densitometric ratios (c. lower panel) of phospho-p53 (p-p53) to total p53 (T-p53) in primary hRTEC. Expression of genes involved in Wnt-β-catenin (d) and Notch (e) signaling pathways from primary hRTECs. * p<0.05 compared to the corresponding KD-HIPK2 group. # p<0.05 compared to the CL+Vector group. $ p<0.05 compared to the HIV+Vector group. α p<0.05 for all tested genes between the indicated groups. Representative blots shown. C = Cells without treatment.
Figure 6
Figure 6. Knockout of HIPK2 prevents kidney injury in Tg26
(a) Urine albumin to creatinine ratio of Tg26 and wildtype (WT) mice with and without HIPK2 knockout (KO) at 3, 4, 6 and 8 weeks of age. (b) Serum urea nitrogen levels of mice at sacrifice. (c) H&E, Masson Trichrome, and Picrosirius red staining of kidney sections. Representative pictures are shown. Scale bar 50μm. (d) Quantification of percentage area with picrosirius red staining by morphometric analysis. (e) Quantification of hydroxyproline content in kidney tissue. Expression of markers of epithelial-mesenchymal transition (f. upper two panels) and target genes of the Wnt-β-catenin (f. third panel), Notch (f. bottle panel) and NFkB (g) pathways in the renal cortex. (h) Western blots for α-smooth muscle actin (αSMA), E-cadherin, phospho- and total-Smad3, p53, and p65, and glyceraldehyde 3-phosphate dehydrogenase (GAPDH). Representative blots from 3 mice in each group are shown. (i) A schematic that summarizes the flow of signals from initial insults (i.e. HIV infection or oxidative stress) to the suppression of SIAH1, expression of HIPK2, and activation of multiple signaling pathways involved in kidney fibrosis. # p<0.05 compared to KO-Tg26. n=6 for all groups. * p<0.05 compared to other groups (WT, KO, and KO-Tg26).

Comment in

References

    1. Wyatt CM, Klotman PE. HIV-associated nephropathy in the era of antiretroviral therapy. Am J Med. 2007;120:488–492. - PubMed
    1. Leventhal JS, Ross MJ. Pathogenesis of HIV-associated nephropathy. Semin Nephrol. 2008;28:523–534. - PubMed
    1. Bruggeman LA, et al. Renal epithelium is a previously unrecognized site of HIV-1 infection. J Am Soc Nephrol. 2000;11:2079–2087. - PubMed
    1. Kopp JB, et al. Progressive glomerulosclerosis and enhanced renal accumulation of basement membrane components in mice transgenic for human immunodeficiency virus type 1 genes. Proc Natl Acad Sci U S A. 1992;89:1577–1581. - PMC - PubMed
    1. Dickie P, et al. HIV-associated nephropathy in transgenic mice expressing HIV-1 genes. Virology. 1991;185:109–119. - PubMed

Publication types

MeSH terms

Associated data