. 2012 Jul;40(12):5227-39.
doi: 10.1093/nar/gks205. Epub 2012 Mar 9.

Extracting regulator activity profiles by integration of de novo motifs and expression data: characterizing key regulators of nutrient depletion responses in Streptomyces coelicolor

Affiliations

Extracting regulator activity profiles by integration of de novo motifs and expression data: characterizing key regulators of nutrient depletion responses in Streptomyces coelicolor

Mudassar Iqbal et al. Nucleic Acids Res. 2012 Jul.

Abstract

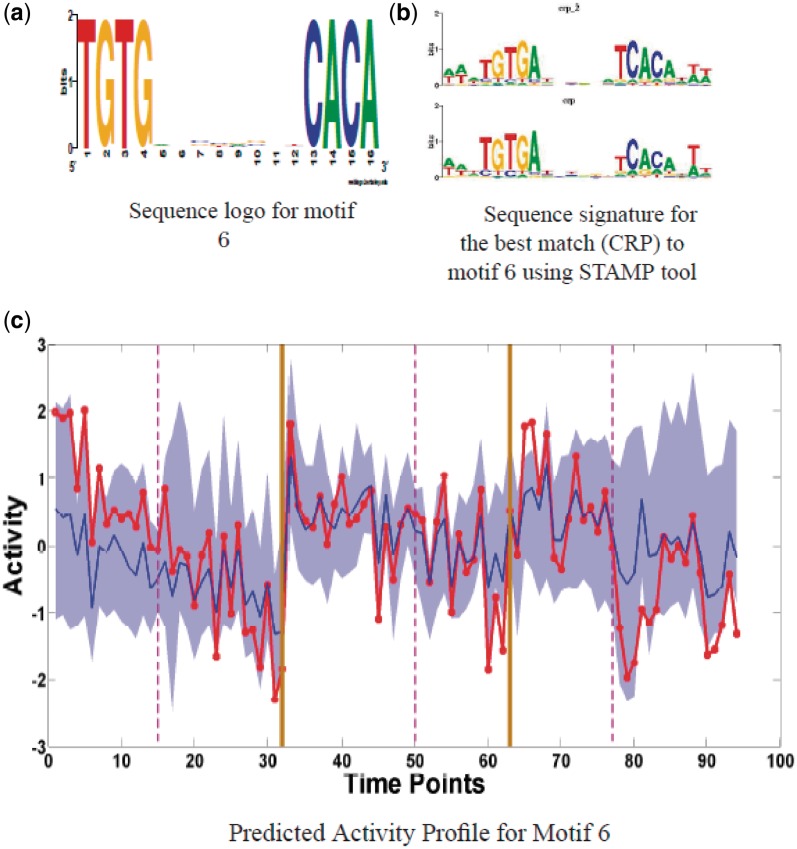
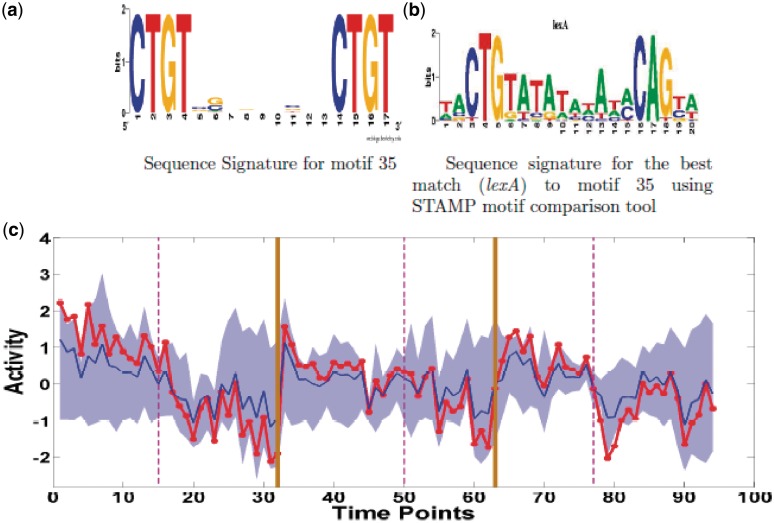
Determining transcriptional regulator activities is a major focus of systems biology, providing key insight into regulatory mechanisms and co-regulators. For organisms such as Escherichia coli, transcriptional regulator binding site data can be integrated with expression data to infer transcriptional regulator activities. However, for most organisms there is only sparse data on their transcriptional regulators, while their associated binding motifs are largely unknown. Here, we address the challenge of inferring activities of unknown regulators by generating de novo (binding) motifs and integrating with expression data. We identify a number of key regulators active in the metabolic switch, including PhoP with its associated directed repeat PHO box, candidate motifs for two SARPs, a CRP family regulator, an iron response regulator and that for LexA. Experimental validation for some of our predictions was obtained using gel-shift assays. Our analysis is applicable to any organism for which there is a reasonable amount of complementary expression data and for which motifs (either over represented or evolutionary conserved) can be identified in the genome.


Figures

Figure 1.
Figure 1.
Activity profiles of selected motifs (those having > 50% correlation with their targets). Shown in red is the (mean) predicted activity of the motif using the factor model while in blue is the average expression profile of the (at most) top five significant targets. The shaded area (light blue) shows the range of the gene profiles of these top significant targets. Vertical lines (grey) separate the three time series, TS1, TS3 and TS5 respectively. Activity profiles of all motifs are given in Supplementary Data (Supplementary Figures S14 and S15).
Figure 2.
Figure 2.
Predicted motif activity profiles grouped into 10 activity clusters. Individual motif patterns are distinguished by colour. In each of the plots, vertical solid lines (Brown) separate the three times series, TS1, TS3 and TS5 respectively, while the vertical dashed lines (Magenta) correspond to the nutrient depletion time in each time series.
Figure 3.
Figure 3.
Motif Sequence logos for activity cluster 7 (15 target genes, 4 motifs). (a–d) Motif logos. Motif 22 (b) is the S. coelicolor directed repeat PHO box, albeit with the missing nt G at the start of the first conserved sequence}. Motif logos generated using (35), http://weblogo.berkeley.edu/.
Figure 4.
Figure 4.
(a) Cluster 5 consensus logo created using the following procedure: The MEME suite (36) was used to construct a common underlying motif among the combined targets in this motif cluster. The logo in (a) was created from the multiple alignment of the sequences corresponding to the MEME output motifs plus some flanking sequences. This extended logo better represents the different overlapping motifs (Supplementary Figure S21) in this cluster than the MEME consensus logo generated from all targets in this activity cluster. (b) Locations of cluster 5 motifs in the upstream regions of the target genes (showing only those targets with at least two motif binding sites).
Figure 5.
Figure 5.
Robustness analysis. The posterior probabilities P(zij = 1) for all common motifs j and genes i are plotted for the two enrichment thresholds, 9% (Original) and 10%. All common motifs/genes between the two cases are plotted. Four subcategories are shown: blue asterisks for links which are ON (Significant) in First run and OFF (Not significant) in second, red squares show links which are OFF in first run and ON in second, green circles represent those links which are ON in both experiments while black point markers correspond to the links which are switched off in both cases. The right panel shows the number of links in each of the four categories of links in this comparison.
Figure 6.
Figure 6.
Comparison of six of our predicted motifs (red) with their 5 best matching known regulators (blue) in S. coelicolor (vertical lines separate the three times series, TS1, TS3 and TS5 respectively). Matching profiles are ascertained by using an Euclidean distance metric. These top hits are, (a) motif 3: XRE family DNA binding protein (SCO6770 which contains HTH3 Helix-turn-helix domain), putative TetR family regulatory protein (SCO4313) and a TetR family transcriptional regulator (SCO0622), a Lacl family transcriptional regulator (SCO0062) as well as a sig15 sigma factor (SCO3068), (b) motif 8: SARP family regulator ActII-ORF4 (actinorhodin cluster regulator SCO5085), Afsr2 sigma like protein (SCO4425), ActII-1 putative TetR family transcriptional regulatory protein (SCO5082), an AraC family regulatory protein (SCO5017), and LuxR (absR2) regulatory protein (SCO6993), (c) motif 22: a response regulator PhoP (SCO4230) and AraC family transcriptional regulator (SCO0266), and MarR family regulatory protein (SCO0940), among others, (d) motif 23: DNA binding protein BldD (SCO1489), AraC family transcriptional regulator (SCO2792), Glk glucokinase (SCO2126) as well as transcriptional regulatory protein GlnR (SCO4159), (e) motif 34: MarR, MerR regulatory proteins (SCO5405, SCO2105) and TetR (SCO3129) family transcriptional regulators and a conserved hypothetical protein(SCO4639) as well as an anti Sigma factor (SCO7324), (f) motif 36: Matches to this motif include important transcriptional and response regulators like (SARP family) RedD (SCO5877) and RedZ (SCO5881) and a LuxR2comp two component regulator (SCO5785).
Figure 7.
Figure 7.
Motif 6 (CRP): (a) Sequence logo for motif 6. (b) Sequence logos for two bacterial CRP family regulators which are very similar to motif 6 with P-values of 1.89e−10 and 6.1e−08. (c) Predicted Activity profile (red) along with the expression range (filled area with mean in blue) of the target genes. Vertical solid lines (Brown) separate three times series, TS1, TS3 and TS5 respectively while the vertical dashed lines (Magenta) correspond to the nutrient depletion time in each time series.
Figure 8.
Figure 8.
Motif 35 (LexA). (a) Sequence logo for motif 35 (b) Sequence logo for bacterial regulator lexA which is found as a best match to motif 35. (c) Predicted Activity profile (red). Annotation as Figure 7.
Figure 9.
Figure 9.
Antibiotic synthesis: (a) Sequence logo for motif 8. (b) Sequence logo for motif 36. (c) Predicted Activity profile (red) for motif 8 and 36. Annotation as Figure 7.

References

    1. Ross PL, Huang YN, Marchese JN, Williamson B, Parker K, Hattan S, Khainovski N, Pillai S, Dey S, Daniels S, et al. Multiplexed protein quantitation in Saccharomyces cerevisiae using amine-reactive isobaric tagging reagents. Mol. Cell. Proteomics. 2004;3:1154–1169. - PubMed
    1. Shadforth IP, Dunkley TPJ, Lilley KS, Bessant C. i-Tracker: for quantitative proteomics using iTRAQ. BMC Genomics. 2005;6 145, doi:10.1186/1471-2164-6-145. - PMC - PubMed
    1. Gao F, Foat BC, Bussemaker HJ. Defining transcriptional networks through integrative modeling of mRNA expression and transcription factor binding data. BMC Bioinformtics. 2004;5 doi:10.1186/1471-2105-5-31. - PMC - PubMed
    1. Ucar D, Beyer A, Parthasarathy S, Workman CT. Predicting functionality of protein-DNA interactions by integrating diverse evidence. Bioinformatics. 2009;25:i137–i144. - PMC - PubMed
    1. Liao J, Boscolo R, Yang Y, Tran LM, Sabatti C, Roychowdhury VP. Network component analysis: reconstruction of regulatory signals in biological systems. PNAS. 2003;100:15522–15527. - PMC - PubMed

Publication types