. 2012 May;4(5):380-95.
doi: 10.1002/emmm.201200215. Epub 2012 Mar 8.

Disease-specific phenotypes in dopamine neurons from human iPS-based models of genetic and sporadic Parkinson's disease

Affiliations

Disease-specific phenotypes in dopamine neurons from human iPS-based models of genetic and sporadic Parkinson's disease

Adriana Sánchez-Danés et al. EMBO Mol Med. 2012 May.

Abstract

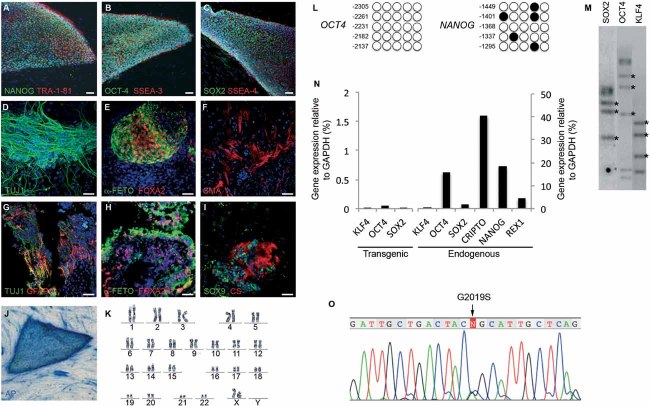
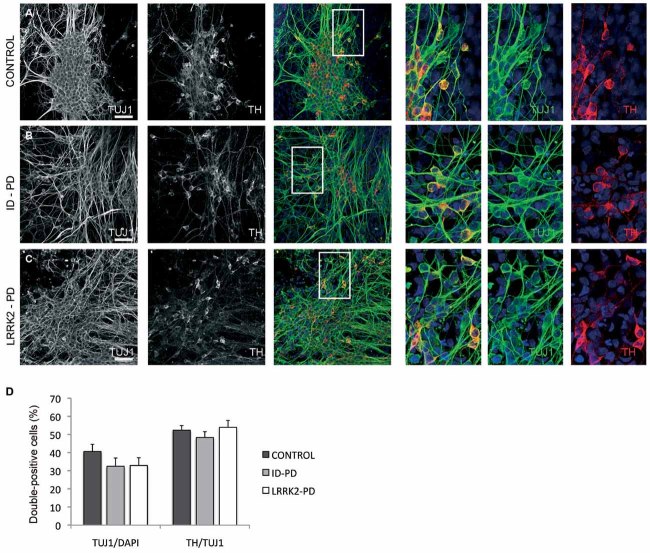
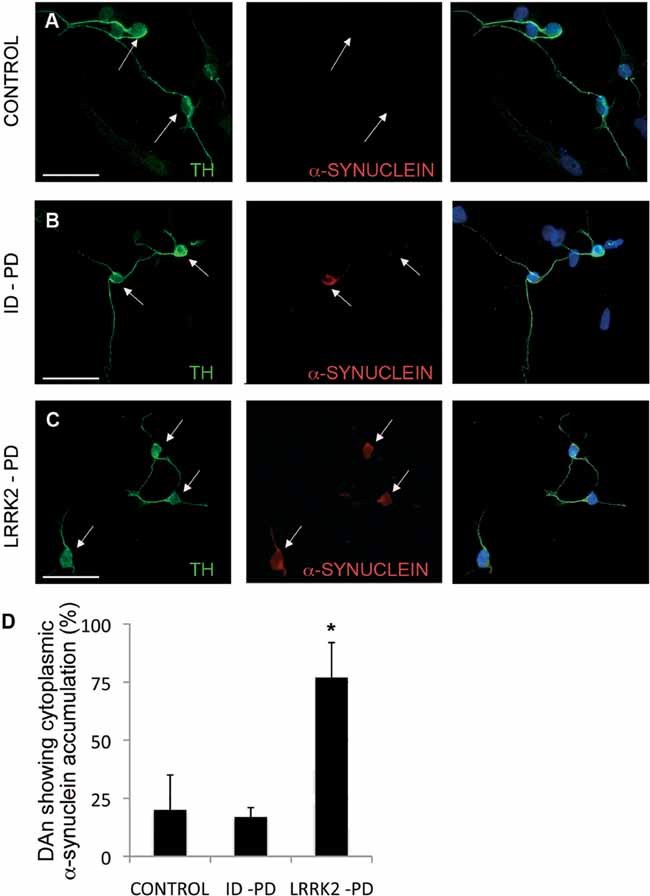
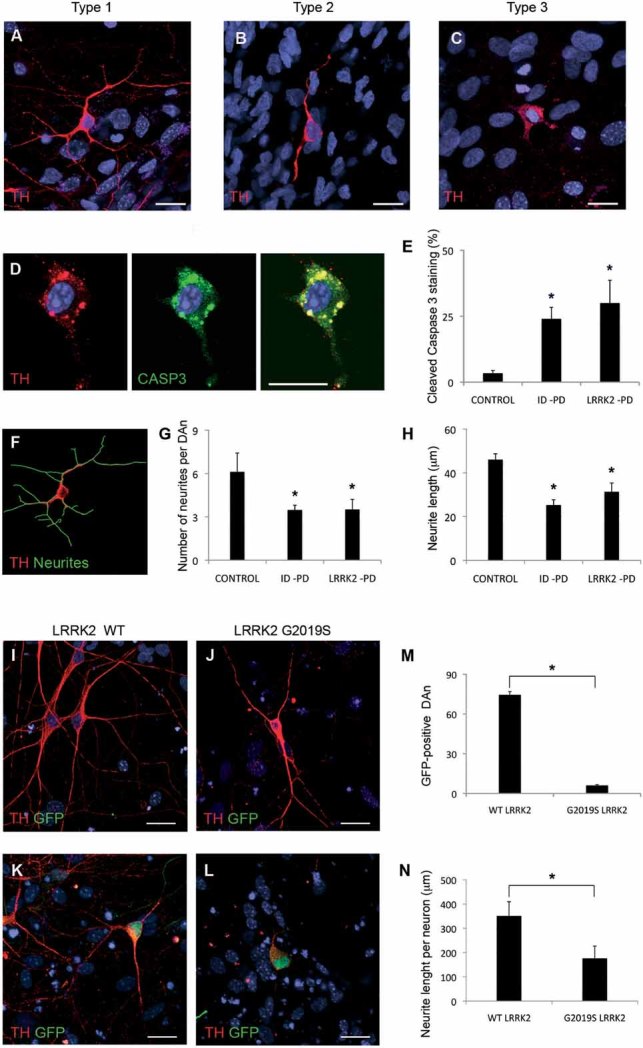
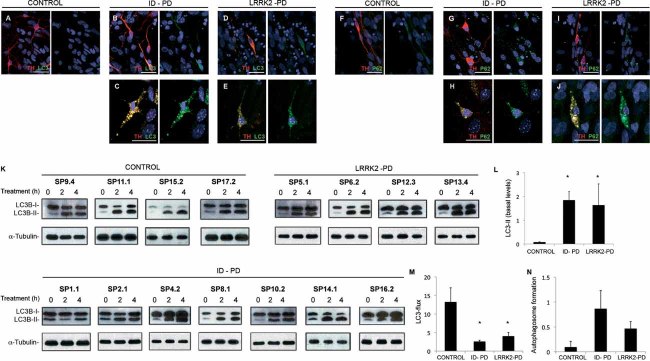
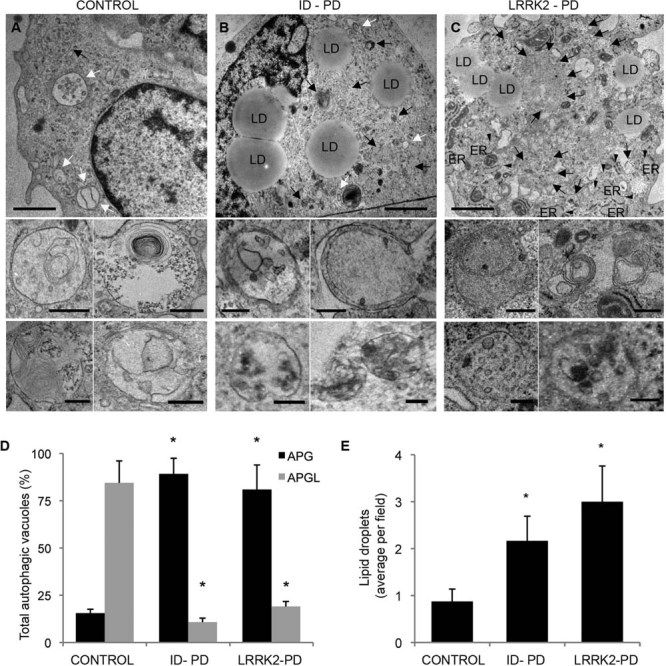
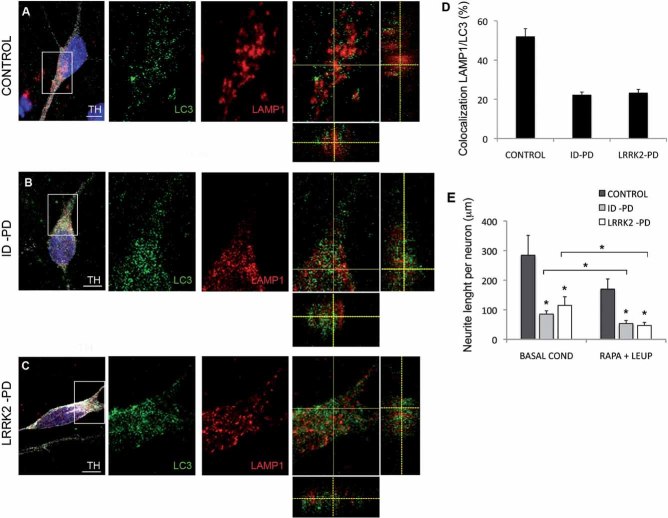
Induced pluripotent stem cells (iPSC) offer an unprecedented opportunity to model human disease in relevant cell types, but it is unclear whether they could successfully model age-related diseases such as Parkinson's disease (PD). Here, we generated iPSC lines from seven patients with idiopathic PD (ID-PD), four patients with familial PD associated to the G2019S mutation in the Leucine-Rich Repeat Kinase 2 (LRRK2) gene (LRRK2-PD) and four age- and sex-matched healthy individuals (Ctrl). Over long-time culture, dopaminergic neurons (DAn) differentiated from either ID-PD- or LRRK2-PD-iPSC showed morphological alterations, including reduced numbers of neurites and neurite arborization, as well as accumulation of autophagic vacuoles, which were not evident in DAn differentiated from Ctrl-iPSC. Further induction of autophagy and/or inhibition of lysosomal proteolysis greatly exacerbated the DAn morphological alterations, indicating autophagic compromise in DAn from ID-PD- and LRRK2-PD-iPSC, which we demonstrate occurs at the level of autophagosome clearance. Our study provides an iPSC-based in vitro model that captures the patients' genetic complexity and allows investigation of the pathogenesis of both sporadic and familial PD cases in a disease-relevant cell type.


Figures

Figure 1
Figure 1. Generation and characterization of PD patient-specific iPSC lines
A-C. Representative colonies of passage-20 LRRK2-PD-iPSC (cell line SP13.4) stained positive for the pluripotency-associated markers NANOG, OCT4 and SOX2 (green), TRA-1-81, SSEA3 and SSEA4 (red). D-F. Immunofluorescence analyses of LRRK2-PD-iPSC (cell line SP13.4) differentiated in vitro show the potential to generate cell derivatives of all three primary germ cell layers including ectoderm (D, stained for TUJ1, green), endoderm (E, stained for α-fetoprotein, green, and FOXA2, red) and mesoderm (F, stained for smooth muscle actin, SMA, red). G-I. Immunofluorescence analyses of sections from a teratoma induced by injecting LRRK2-PD-iPSC (cell line SP13.4), showing derivatives of the three main embryo germ layers: ectoderm (G, stained for TUJ1, green, and GFAP, red), endoderm (H, stained for α-fetoprotein, green, and FOXA2, red) and mesoderm (I, stained for SOX9, green, and chondroitin sulphate, CS, red). In (A–I) nuclei are counterstained with DAPI, shown in blue. Scale bars, 50 µm. J. LRRK2-PD-iPSC (cell line SP13.4) stained for alkaline phosphatase (AP) activity. K. Normal karyotype of LRRK2-PD-iPSC (cell line SP13.4) at passage 20. L. Bisulphite genomic sequencing of the OCT4 and NANOG promoters showing demethylation in LRRK2-PD-iPSC (cell line SP13.4). M. Southern blot analysis of LRRK2-PD-iPSC (cell line SP13.4) showing genomic integrations (asterisk) of the indicated retroviruses. N. RT-qPCR analyses of the expression levels of retroviral-derived reprogramming factors (transgenic) and endogenous expression levels (endogenous) of the indicated genes in LRRK2-PD-iPSC (cell line SP13.4). O. Direct sequence of genomic DNA from LRRK2-PD-iPSC (cell line SP13.4) identifying the LRRK2G2019S mutation.
Figure 2
Figure 2. Differentiation of DA neurons from PD patient-specific iPSC
Ctrl-, ID-PD and LRRK2-PD iPSC were differentiated into DA neurons and analysed by immunofluorescence for expression of TUJ1 (green) and TH (red) at the end of the 30-day differentiation protocol. A-C. All iPSC-derived neurons express TUJ1 and TH. Shown are representative images of differentiation experiments from Ctrl-iPSC (cell line SP11.1), ID-PD iPSC (cell line SP08.1) and LRRK2-PD iPSC (cell line SP06.2). Nuclei are counterstained with DAPI, shown in blue. Scale bars, 50 µm. D. Quantitative analyses of cells stained positive for TUJ1 (left bars) or TUJ1 and TH (right bars). TUJ1-positive cells are represented as the percentage of total number of cells (stained with DAPI). Bars represent average with SEM as error bars. Data for CONTROL is the average of 4 iPSC lines, for ID-PD from 7 iPSC lines and LRRK2-PD from 4 iPSC. No significant differences were found in the ability of iPSC to generate neurons [F(2,12) = 0.953; p = 0.413] or DA neurons [F(2,12) = 0.679; p = 0.526] after 30 days of differentiation.
Figure 3
Figure 3. Abnormal SNCA accumulation in DA neurons from LRRK2-PD iPSC
A-C. Immunofluorescence analyses of DA neurons after 30 days of differentiation from Crtl-iPSC (A), ID-PD iPSC (B) and LRRK2-PD iPSC (C), co-stained for TH (green) and SNCA (red). Arrows point to DA neurons, as identified by TH positive staining. D. Quantitative analyses of DA neurons showing cytoplasmic accumulation of SNCA. Bars represent average with SEM as error bars. Data is the average of at least two-independent experiments using 3 Ctrl-iPSC lines, 4 ID-PD iPSC lines and 3 LRRK2-PD iPSC lines. The differences in the number of DA neurons showing accumulation of SNCA are statistically significant (asterisk) when comparing those derived from LRRK2-PD iPSC with either those from Ctrl-iPSC (p = 0.019) or from ID-PD iPSC (p = 0.002) [F(2,16) = 6.888; p = 0.007].
Figure 4
Figure 4. Morphological alterations of PD-iPSC-derived DA neurons after long-term culture
A-C. Immunofluorescence analyses of Ctrl-iPSC (cell line SP11.1, A), ID-PD iPSC (cell line SP08.1, B) and LRRK2-PD iPSC (cell line SP06.2, C), differentiated towards DA neurons and cultured for 75 days on cortical astrocytes, stained for TH (red). Images are representative of the three morphologies of DA neurons found under these conditions. D. Immunofluorescence analysis of DA neurons differentiated from LRRK2-PD iPSC (cell line SP06.2) for 75 days, co-stained for TH (red) and cleaved caspase-3 (green). In A–D nuclei are counterstained with DAPI, shown in blue. Scale bar, 12.5 µm. E. Quantitative analyses of the percentage of DA neurons differentiated for 75 days showing cleaved caspase-3 staining. Data for CONTROL is the average of 4 iPSC lines, for ID-PD from 7 iPSC lines and LRRK2-PD from 4 iPSC. Asterisks denote statistically significant differences between CONTROL and ID-PD (p = 0.004) or LRRK2-PD (p = 0.011) [F(2,12) = 5.668; p = 0.018]. F. Image of the same DA neuron shown in (A), with neurites outlined by green traces as processed by NIH ImageJ software. G. Quantitative analyses of the number of neurites in DAn differentiated for 75 days. Data for CONTROL is the average of 87 DAn from 4 iPSC lines, for ID-PD is from 119 DAn from 7 iPSC lines and for LRRK2-PD is from 91 DAn from 4 iPSC. Asterisks denote statistically significant differences between CONTROL and ID-PD (p < 0.001) or LRRK2-PD (p < 0.001) [F(2,294) = 21.096; p < 0.001]. H. Quantitative analyses of the neurite length in DA neurons differentiated for 75 days. Data for CONTROL is the average of 540 neurites from 4 iPSC lines, for ID-PD is from 409 neurites from 7 iPSC lines and for LRRK2-PD is from 303 neurites from 4 iPSC. Asterisks denote statistically significant differences between CONTROL and ID-PD (p < 0.001) or LRRK2-PD (p < 0.001) [F(2,1249) = 42.161; p < 0.001]. (E, G and H) bars represent average with SEM as error bars. I-L. DAn (TH positive, red) and GFP (green) from Ctrl-iPSC (SP11.1) co-transfected with plasmids encoding WT LRRK2 (WT, I and K) or mutant LRRK2G2019S (J and L) and GFP. (I and J) Images showing GFP negative DA neurons. (K and L) Co-transfected DA neurons being GFP positive. Nuclei are counterstained with DAPI, shown in blue. Scale bar, 12.5 µm. M. Quantitative analysis of the number of GFP positive neurons present in co-transfected cells. N. Quantitative analyses of the neurite length per neuron in co-transfected DAn. For (M and N) data are average of two-independent experiments using two different Ctrl-iPSC lines. Bars represent average with SEM as error bars. Statistically significant differences are indicated with asterisks (p = 0.003 in M; p = 0.006 in N).
Figure 5
Figure 5. Alterations in autophagic clearance in DA neurons from PD patient-specific iPSC
A-E. Immunofluorescence analyses of Ctrl-iPSC (cell line SP17.2, A), ID-PD iPSC (cell line SP16.2, B and C) and LRRK2-PD iPSC (cell line SP12.3, D and E), differentiated towards DA neurons and cultured for 75 days on cortical astrocytes, co-stained for LC3 (green) and TH (red). Images are representative of the most abundant morphologies of DA neurons found under these conditions. F-J. Immunofluorescence analyses of Ctrl-iPSC (cell line SP17.2, F), ID-PD iPSC (cell line SP10.2, G and H) and LRRK2-PD iPSC (cell line SP06.2, I and J), differentiated towards DA neurons and cultured for 75 days on cortical astrocytes, co-stained for p62 (green) and TH (red). Images are representative of the morphologies of DA neurons found under these conditions. In A–J, nuclei are counterstained with DAPI, shown in blue. Scale bars, 35 µm. K. Western blot analysis for LC3 in DA neuron cultures at 75 days of differentiation from the indicated iPSC lines, treated with leupeptin and NH4Cl during the indicated period of time. α-tubulin is used as a loading control. L. Quantification analyses of the basal levels (treatment time = 0) of LC3-II relative to α-tubulin. Asterisks denote statistically significant differences between CONTROL and ID-PD (p = 0.003) and between CONTROL and LRRK2-PD (p = 0.046) [F(2,12) = 4.253; p = 0.046]. M. Quantification of LC3 flux normalized to α-tubulin. Asterisks denote statistically significant differences between CONTROL and ID-PD (p = 0.002) and between CONTROL and LRRK2-PD (p = 0.029) [F(2,12) = 9.614; p = 0.003]. N. Quantification of the autophagosome formation normalized to α-tubulin. No significant differences were found among groups [F(2,12) = 1.570; p = 0.248]. (L–N) Data per each group is the average of the blots shown in K. Bars represent average with SEM as error bars.
Figure 6
Figure 6. Autophagic system in iPSC-derived neurons
A-C. Ultrastructure of DA neurons at 75 days of differentiation from Ctrl-iPSC (A), ID-PD iPSC (B) and LRRK2-PD (C) iPSC. Lower inserts show higher magnification images to illustrate individual examples of autophagic vacuoles. Black arrows: autophagosomes; white arrows: autophagolysosomes; arrowheads: dilated ER; LD: lipid droplets. Scale bars: 0.5 µm (top) and 0.2 µm (bottom). D. Percentage of autophagosomes (APG) and autophagolysosomes (APGL) relative to the total amount of autophagic vacuoles per field. Asterisks denote statistically significant differences in the percentage of autophagosomes [F(2,16) = 28.274; p < 0.001] and of autophagolysosomes [F(2,16) = 8.894; p = 0.003] between CONTROL and ID-PD (autophagosomes, p < 0.001; autophagolysosomes, p = 0.003), and between CONTROL and LRRK2-PD (autophagosomes, p = 0.003; autophagolysosomes, p = 0.010). E. Content of lipid droplets per field. Asterisks denote statistically significant differences [F(2,16) = 28.274; p < 0.001] between CONTROL and ID-PD (p = 0.010), and between CONTROL and LRRK2-PD (p = 0.013). Bars represent average with SEM as error bars (n = 4–8).
Figure 7
Figure 7. Defective autophagosome clearance in PD-iPSC-derived DA neurons
A-C. DAn (TH positive, white) cultured on astrocytes for 75 days stained for LC3 (green) and LAMP1 (red) after 6 h of treatment with leupeptin from CONTROL (cell line SP11.1, A), ID-PD (cell line SP10.2, B) and LRRK2-PD (cell line SP05.1, C) iPSC. Z-stack views are shown on the merged images (right panels). Nuclei are counterstained with DAPI, shown in blue. Scale bars, 5 µm. D. Quantitative analyses of the colocalization of LAMP1 and LC3. Data for each group is the average of 15, 15 and 14 DAn representing three different Ctrl-, ID-PD and LRKK2-PD iPSC lines, respectively. Asterisks denote statistically significant differences between CONTROL and ID-PD (p < 0.001) or LRRK2-PD (p < 0.001) [F(2,41) = 41.628; p < 0.001]. E. Quantitative analyses of the total neurite length per neuron with or without treatment with rapamycin and leupeptin. Under basal conditions (without treatment), data for CONTROL is the average of 97 DAn from 4 iPSC lines, for ID-PD is from 127 DAn from 7 iPSC lines and for LRRK2-PD is from 80 DAn from 4 iPSC lines. After treatment with rapamycin and leupeptin (RAPA + LEUP), data for CONTROL is the average of 60 DAn from 4 iPSC lines, for ID-PD is from 112 DAn from 7 iPSC lines and for LRRK2-PD is from 74 DAn from 4 iPSC lines. Asterisks above data bars denote statistically significant differences under basal conditions [F(2,301) = 5.886; p = 0.003] between CONTROL and ID-PD (p = 0.003), and between CONTROL and LRRK2-PD (p = 0.022), and after treatment with rapamycin and leupeptin [F(2,243) = 48.812; p < 0.001] between CONTROL and ID-PD (p < 0.001), and between CONTROL and LRRK2-PD (p < 0.001). Asterisks comparing data sets denote statistically significant differences in total neurite length after treatment with rapamycin and leupeptin in DAn from ID-PD (p = 0.001) and LRRK2-PD (p < 0.001), but not from CONTROL (p = 0.090). In (D–E) bars represent average with SEM as error bars.

References

    1. Aasen T, Raya A, Barrero MJ, Garreta E, Consiglio A, Gonzalez F, Vassena R, Bilic J, Pekarik V, Tiscornia G, et al. Efficient and rapid generation of induced pluripotent stem cells from human keratinocytes. Nat Biotechnol. 2008;26:1276–1284. - PubMed
    1. Carvajal-Vergara X, Sevilla A, D'Souza SL, Ang YS, Schaniel C, Lee DF, Yang L, Kaplan AD, Adler ED, Rozov R, et al. Patient-specific induced pluripotent stem-cell-derived models of LEOPARD syndrome. Nature. 2010;465:808–812. - PMC - PubMed
    1. Chu CT, Plowey ED, Dagda RK, Hickey RW, Cherra S,J, III, Clark RS. Autophagy in neurite injury and neurodegeneration: in vitro and in vivo models. Methods Enzymol. 2009;453:217–249. - PMC - PubMed
    1. Cookson MR. The role of leucine-rich repeat kinase 2 (LRRK2) in Parkinson's disease. Nat Rev Neurosci. 2010;11:791–797. - PMC - PubMed
    1. Dawson TM, Ko HS, Dawson VL. Genetic animal models of Parkinson's disease. Neuron. 2010;66:646–661. - PMC - PubMed

Publication types