. 2012 Apr 15;18(8):2199-209.
doi: 10.1158/1078-0432.CCR-11-1669. Epub 2012 Mar 8.

Stem-like tumor-initiating cells isolated from IL13Rα2 expressing gliomas are targeted and killed by IL13-zetakine-redirected T Cells

Affiliations

Stem-like tumor-initiating cells isolated from IL13Rα2 expressing gliomas are targeted and killed by IL13-zetakine-redirected T Cells

Christine E Brown et al. Clin Cancer Res. .

Abstract

Purpose: To evaluate IL13Rα2 as an immunotherapeutic target for eliminating glioma stem-like cancer initiating cells (GSC) of high-grade gliomas, with particular focus on the potential of genetically engineered IL13Rα2-specific primary human CD8(+) CTLs (IL13-zetakine(+) CTL) to target this therapeutically resistant glioma subpopulation.

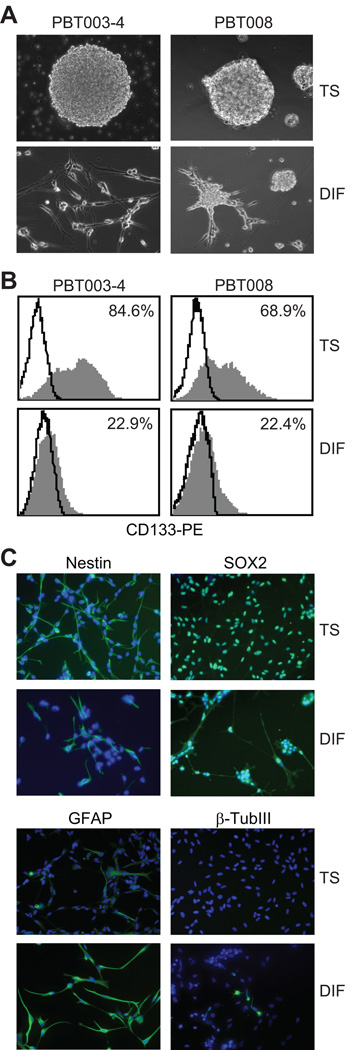
Experimental design: A panel of low-passage GSC tumor sphere (TS) and serum-differentiated glioma lines were expanded from patient glioblastoma specimens. These glioblastoma lines were evaluated for expression of IL13Rα2 and for susceptibility to IL13-zetakine(+) CTL-mediated killing in vitro and in vivo.

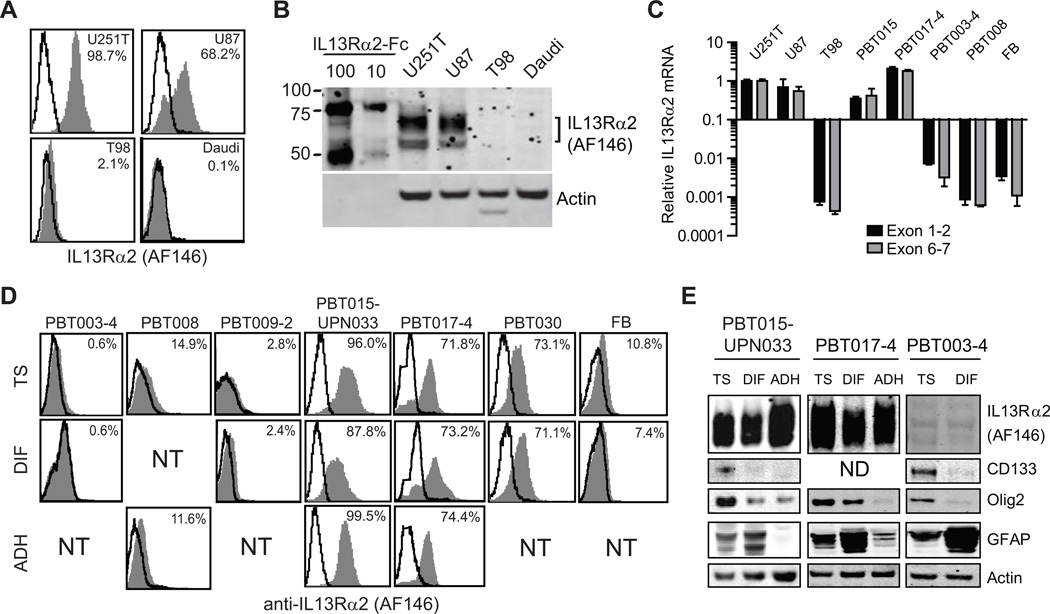
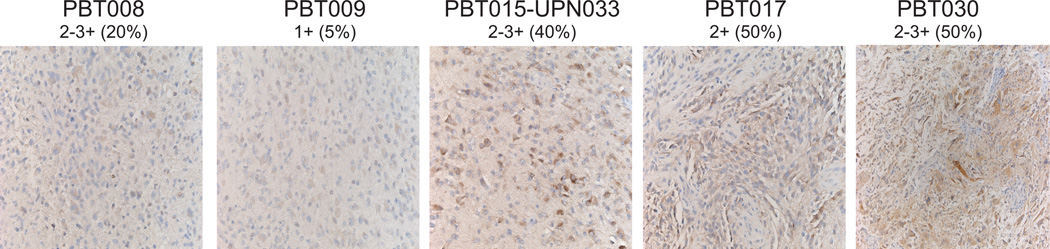
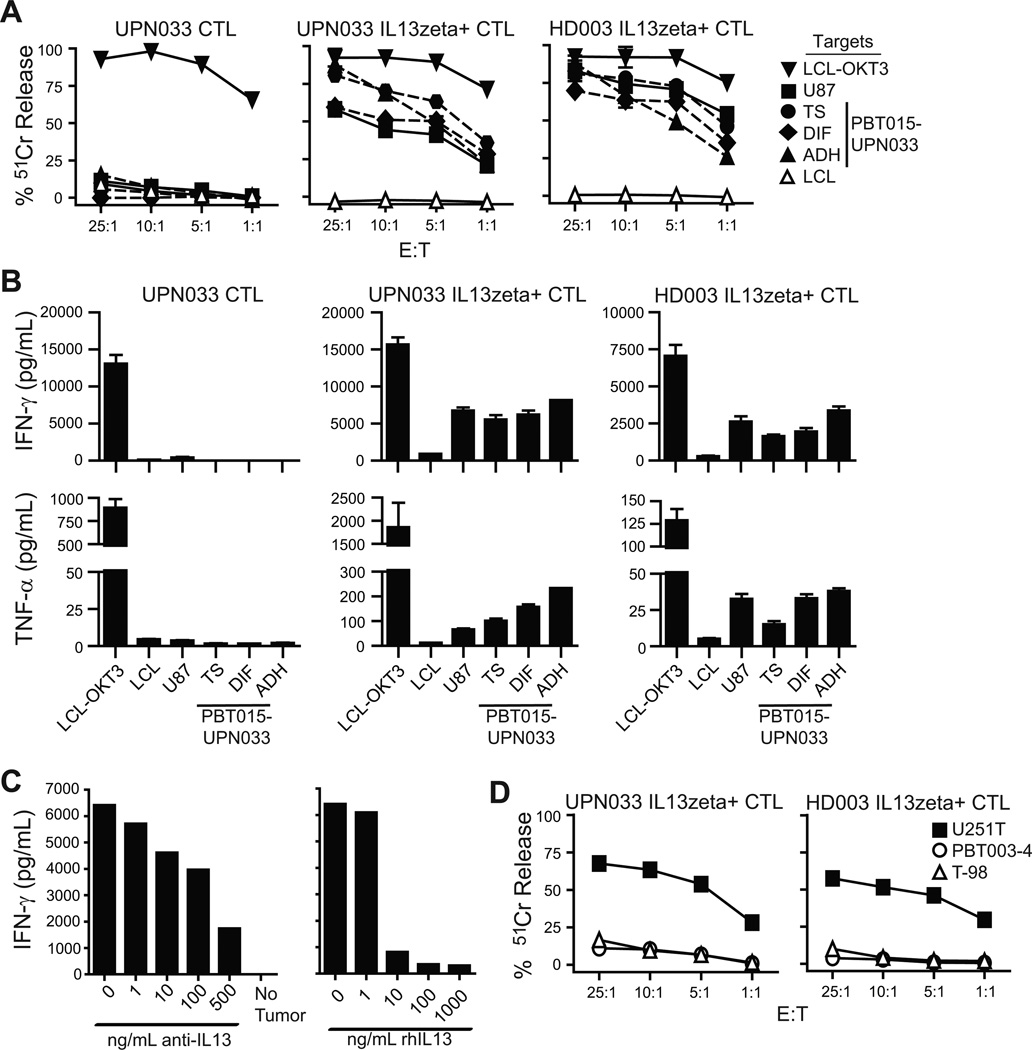
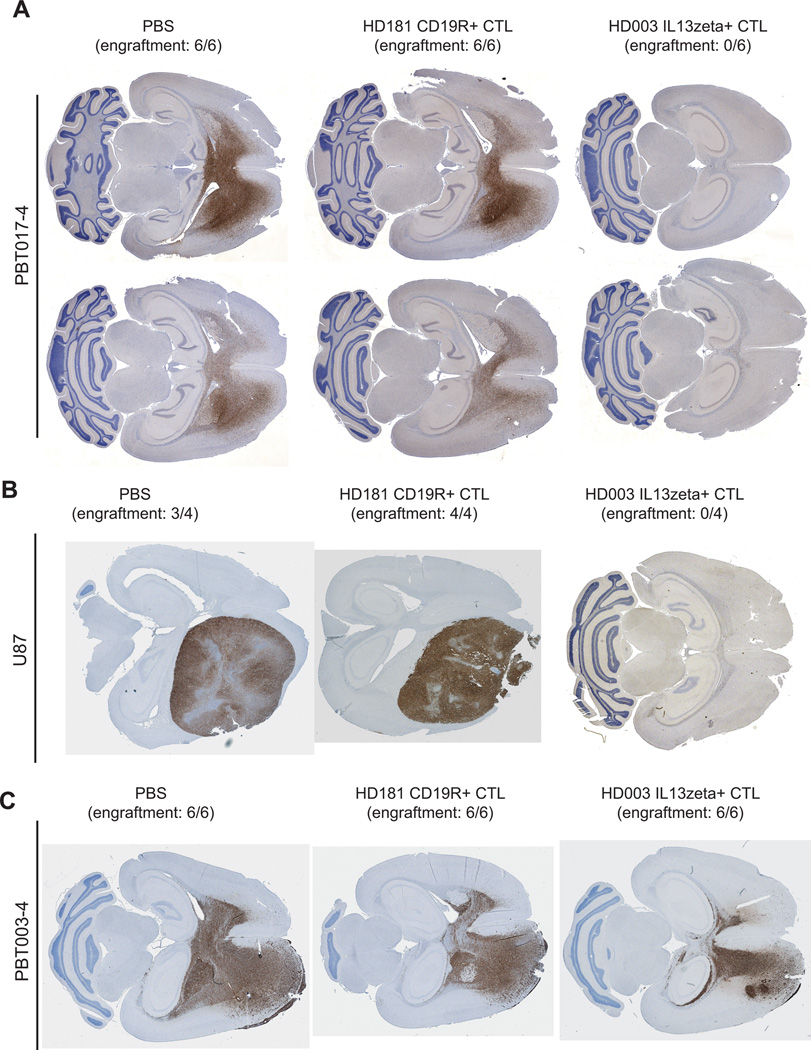
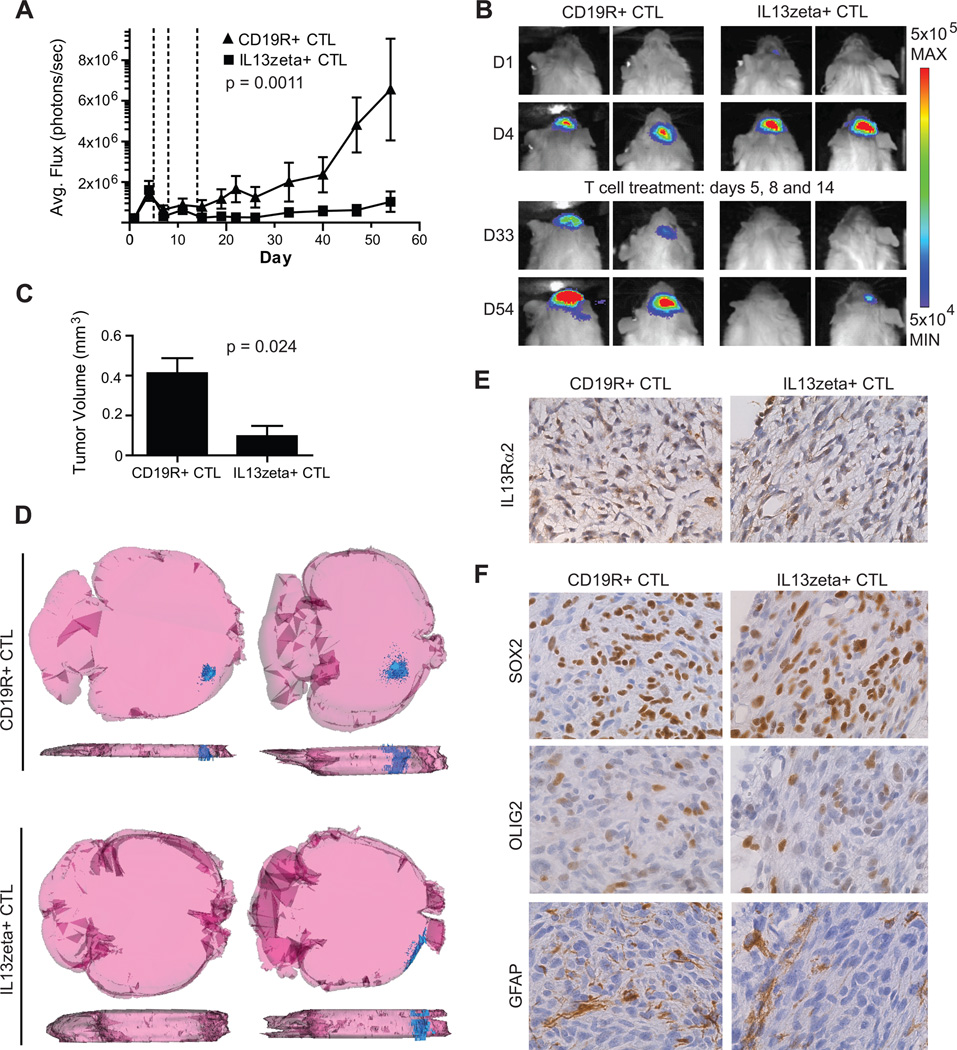
Results: We observed that although glioma IL13Rα2 expression varies between patients, for IL13Rα2(pos) cases this antigen was detected on both GSCs and more differentiated tumor cell populations. IL13-zetakine(+) CTL were capable of efficient recognition and killing of both IL13Rα2(pos) GSCs and IL13Rα2(pos) differentiated cells in vitro, as well as eliminating glioma-initiating activity in an orthotopic mouse tumor model. Furthermore, intracranial administration of IL13-zetakine(+) CTL displayed robust antitumor activity against established IL13Rα2(pos) GSC TS-initiated orthotopic tumors in mice.

Conclusions: Within IL13Rα2 expressing high-grade gliomas, this receptor is expressed by GSCs and differentiated tumor populations, rendering both targetable by IL13-zetakine(+) CTLs. Thus, our results support the potential usefullness of IL13Rα2-directed immunotherapeutic approaches for eradicating therapeutically resistant GSC populations.


Conflict of interest statement

MCJ is an inventor of licensed patents and equity holder in ZetaRx, Inc a licensee of these patents. Other authors have no conflicts of interest to disclose.

Figures

Figure 1
Figure 1. Characterization of tumor sphere and serum-differentiated cells isolated from primary high-grade glioma specimens
(A) Representative images of tumor sphere cells grown in serum-free stem cell medium (TS, top panels), and after transfer to differentiating FCS-containing medium (DIF, bottom panels). (B) Flow cytometry of TS and DIF cells stained with anti-CD133 (gray) or isotype control antibody (solid lines). Percentage of CD133+ cells is indicated. (C) Immunofluorescence of PBT003-4 TS and DIF cells stained for stem cell markers nestin and SOX2 (green, top panels); and lineage specific differentiation markers GFAP and β-III tubulin (green, bottom panels). Cell nuclei were stained blue with DAPI.
Figure 2
Figure 2. IL13Rα2 expression on GSC and differentiated glioma cell lines
(A) Flow cytometric detection of IL13Rα2 on established glioma cell lines U251T, U87 and T98. Daudi lymphoma is an IL13Rα2neg control cell line. Percentage positive cells are indicated in each histogram. (B) Western blots detecting IL13Rα2 for established glioma cell lines. Recombinant human IL13Rα2-Fc (10ng and 100ng) demonstrates receptor-specific detection by the antibody. (C) RT-qPCR analysis depicting IL13Rα2 mRNA expression by cell lines relative to U251T using primer sets spanning IL13Rα2 exons 1–2 and 6–7. Data was normalized to actin. (D) Tumor sphere (TS), serum-differentiated (DIF), and serum-expanded (ADH) cells analyzed by flow cytometry for expression of IL13Rα2 (grey histograms); solid lines are secondary antibody alone. NT; not tested. (E) Western blots detecting IL13Rα2, CD133, Olig2, GFAP, and α-actin for TS, DIF, and ADH cell lines. ND, not detected.
Figure 3
Figure 3. IL13Rα2 expression on primary patient-derived glioma specimens
IHC detection of IL13Rα2 on paraffin-embedded patient tumor tissue. Sections where scored blindly by a Neuropathologist for staining intensity (0 not detected; 1+ low; 2+ moderate; 3+ high), and percentages of positive cells are indicated.
Figure 4
Figure 4. IL13-zetakine+ CTL kill with comparable potency IL13Rα2pos GSCs, differentiated cells, and established glioma cell lines
(A) CRA measuring the lysis of IL13Rα2pos U87 glioma cells or PBT015-UPN033 derived TS, 7-day serum-differentiated (DIF), or serum-expanded (p15; ADH) cells at increasing effector:target (E:T) ratios. The IL13Rα2neg CD19pos LCL served as an antigen negative control target, and LCL-OKT3 established the maximum capacity of all CTL lines for cytolytic lysis. Graph titles indicate T cell effector lines tested, which include the autologous UPN033 parental CD8+ CTL bulk line (UPN033 CTL) and CD8+ IL13-zetakine+ CTL clone 3C12 (UPN033 IL13zeta+ CTL), and an allogeneic CD8+ IL13-zetakine+ CTL clone 2D7 (HD003 IL13zeta+ CTL). Mean ± S.D. values of 6 wells are depicted. (B) IFN-γ and TNF-α produced by the indicated CD8+ T cell lines after overnight co-culture with tumor targets described in (A). Mean ± S.D. values of 3 replicate measurements from a representative experiment is depicted. (C) Inhibition of PBT015-UPN033 TS driven IFN-γ and TNF-α produced by CD8+ IL13-zetakine+ CTL clone 3C12 as in (B) upon pre-incubation of the CTL with increasing concentrations of blocking rat anti-human IL13 antibody (left panel) or PBT015-UPN033 TS target cells with rhIL13 (right panel). (D) CRA measuring lysis of IL13Rα2neg glioma lines PBT003-4 TS and T98 cells versus IL13Rα2pos U251T by the indicated CD8+ IL13-zetakine+ CTL at increasing E:T ratios. Mean ± S.D. values of wells (n=6) are depicted.
Figure 5
Figure 5. IL13Rα2-specific CTLs ablate the tumor initiation population of IL13Rα2-expressing GSCs
(A) PBT017-4 TS (2×10⁵) were co-injected i.c. with the specified CTL (2×10⁶) or PBS into NOD-scid mice; n = 6 mice per group. Mice were euthanized after 8 weeks, and harvested brains were analyzed by IHC for tumor engraftment using anti-human nestin (number of mice with engrafted tumors per group of 6 is indicated). Representative images from 2 mice per group are depicted (tiled horizontal brain sections). (B) U87 cells (2×10⁵), and (C) PBT003-4 TS cells (2×10⁵) were co-injected i.c. with CAR+ CTLs or PBS in NOD-scid mice as described in (A)
Figure 6
Figure 6. Regression of established GSC-initiated xenografts after adoptive transfer of IL13-zetakine+ T cells
(A) EGFP-ffLuc+ PBT030-2 TSs (1×10⁵) were stereotacitcally implanted into the right forebrain of NSG mice. On days 5, 8 and 14 (dotted vertical lines), mice received either 2×10⁶ IL13-zetakine+ CTL clone 2D7 (HD003 IL13zeta+ CTL) (n=10) or CD19R+ CTL clone E8 (HD181 CD19R+ CTL) (n=8). Quantification of tumor growth kinetics using Xenogen Living Image to measure average ffLuc flux (photons/sec) demonstrates that IL13-zetakine+ CTLs induce tumor growth regression when compared with CD19R+ CTLs (p = 0.0011, two-way ANOVA with repeated natural log transformed measures on time, days 15–54). (B) Representative Xenogen images for two mice at days 1 and 4 before T cell administration and at days 33 and 54 post T cell treatment. (C, D, E, F) Xenograft tumors (i.c.) of PBT017-4 (1×10⁵) were treated as described in (A) on days 5, 8 and 13. On day 28 (15 days post last T cell administration) mice brains were harvested and tumor volume was quantified by IHC. (C) Graph depicts the mean tumor volume (mm3) ± standard error for IL13-zetakine+ CTL (n=4) versus CD19R+ CTL (n=4) treated tumors (p = 0.024, two-tailed Student’s t-test). (D) The smallest (left) and largest (right) reconstructed tumors (blue pseudo-color) from each group are shown from both the dorsal (top) and sagittal (bottom) views. (E) anti-IL13Rα2 IHC, and (F) anti-SOX2, anti-OLIG2 and anti-GFAP IHC on paraffin sections of persisting tumors following adoptive transfer of glioma-specific IL13-zetakine+ CTL and control CD19R+ CTLs.

References

    1. Dirks PB. Brain tumor stem cells: bringing order to the chaos of brain cancer. J Clin Oncol. 2008;26:2916–2924. - PubMed
    1. Li Z, Wang H, Eyler CE, Hjelmeland AB, Rich JN. Turning cancer stem cells inside out: an exploration of glioma stem cell signaling pathways. J Biol Chem. 2009;284:16705–16709. - PMC - PubMed
    1. Hadjipanayis CG, Van Meir EG. Tumor initiating cells in malignant gliomas: biology and implications for therapy. J Mol Med. 2009;87:363–374. - PMC - PubMed
    1. Zhou BB, Zhang H, Damelin M, Geles KG, Grindley JC, Dirks PB. Tumour-initiating cells: challenges and opportunities for anticancer drug discovery. Nat Rev Drug Discov. 2009;8:806–823. - PubMed
    1. Eyler CE, Rich JN. Survival of the fittest: cancer stem cells in therapeutic resistance and angiogenesis. J Clin Oncol. 2008;26:2839–2845. - PMC - PubMed

Publication types

MeSH terms

Substances