. 2012 Mar;24(3):1034-48.
doi: 10.1105/tpc.111.094383. Epub 2012 Mar 9.

Genetic control of seed shattering in rice by the APETALA2 transcription factor shattering abortion1

Affiliations

Genetic control of seed shattering in rice by the APETALA2 transcription factor shattering abortion1

Yan Zhou et al. Plant Cell. 2012 Mar.

Abstract

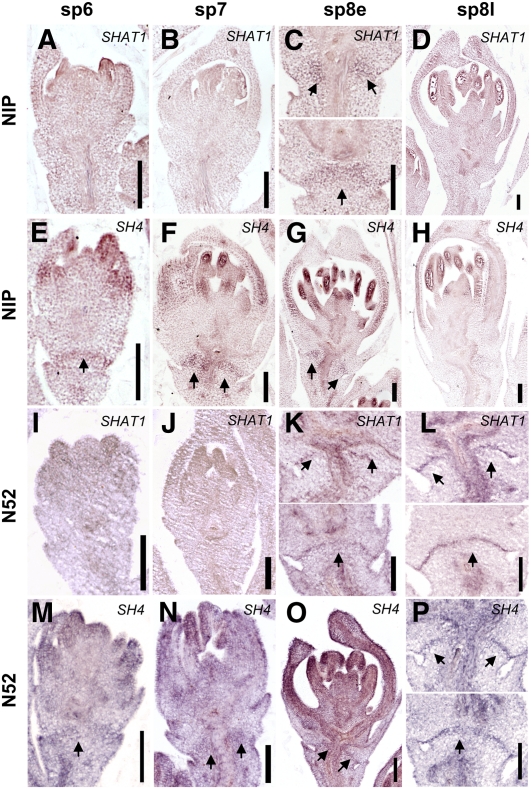
Seed shattering is an important agricultural trait in crop domestication. SH4 (for grain shattering quantitative trait locus on chromosome 4) and qSH1 (for quantitative trait locus of seed shattering on chromosome 1) genes have been identified as required for reduced seed shattering during rice (Oryza sativa) domestication. However, the regulatory pathways of seed shattering in rice remain unknown. Here, we identified a seed shattering abortion1 (shat1) mutant in a wild rice introgression line. The SHAT1 gene, which encodes an APETALA2 transcription factor, is required for seed shattering through specifying abscission zone (AZ) development in rice. Genetic analyses revealed that the expression of SHAT1 in AZ was positively regulated by the trihelix transcription factor SH4. We also identified a frameshift mutant of SH4 that completely eliminated AZs and showed nonshattering. Our results suggest a genetic model in which the persistent and concentrated expression of active SHAT1 and SH4 in the AZ during early spikelet developmental stages is required for conferring AZ identification. qSH1 functioned downstream of SHAT1 and SH4, through maintaining SHAT1 and SH4 expression in AZ, thus promoting AZ differentiation.


Figures

Figure 1.
Figure 1.
Characterization of Seed Shattering and Floral AZ Morphology in Wild Type and Different Mutant Lines. (A) Bagged panicles harvested from wild-type (WT; SL4), shat1 mutant, shat2 mutant, and shat1 shat2 double mutant plants when seeds were fully ripened. Right corner in the wild-type photo shows the automatically shattering seeds collected in the bag. Bars = 1 cm. (B) Force required to pull flowers or grains off of pedicels of the wild type, shat1 mutant, shat2 mutant, and shat1 shat2 double mutant on the day of flower opening (0) and every 3 or 2 d thereafter during seed development. Error bars, ±sd. (C) to (Z) Morphological characteristics of AZs. The four rows from top to bottom represent morphological analyses of the wild type, shat1 mutant, shat2 mutant, and shat1 shat2 double mutant, respectively. (C), (I), (O), and (U) show the spikelets. The white boxes indicate the region where AZ is located. Bars = 1 mm. (D), (J), (P), and (V) show close-up views corresponding to the white boxes in (C), (I), (O), and (U), respectively. Arrows indicate the position of AZ. Bars = 0.5 mm. (E), (K), (Q), and (W) show fluorescence images of longitudinal sections across flower and pedicel junction stained by Acridine Orange. The white boxes indicate the region where AZ is located. Bars = 50 μm. (F), (L), (R), and (X) show close-up views corresponding to the white boxes in (E), (K), (Q), and (W), respectively. Arrows point to the AZ in the wild type or the corresponding region in mutant lines. Bars = 50 μm. (G), (M), (S), and (Y) show scanning electron microscopy photos of the pedicel junction after detachment of seeds. Bars = 100 μm. The white boxes contain the outer and the center region on the surface. (H), (N), (T), and (Z) show close-up scanning electron microscopy photos corresponding to the white boxes in (G), (M), (S), and (Y). Peeled-off and smooth surfaces are observed in the wild type (H), whereas broken and rough surfaces are observed in shat1 (N), shat2 (T), and shat1 shat2 (Z). Bars = 50 μm.
Figure 2.
Figure 2.
Map-Based Cloning of SHAT1 and SHAT2. (A) Fine-mapping of the SHAT1 locus. The SHAT1 locus was narrowed down to a 9-kb region between markers A and B on chromosome 4 using 300 homozygous F2 plants and is indicated by a pink arrow. Numbers below the horizontal line are the number of recombinants. (B) Schematic representation of the SHAT1 gene. Exons and introns are represented by yellow boxes and horizontal lines, respectively. The start codon (ATG) and stop codon (TAA) sites are indicated by vertical crossing lines. Location of the mutation site is indicated by a vertical arrow. The red star indicates the site of a premature stop codon caused by the 1-bp deletion. (C) Amino acid sequence alignments of the AP2 domain. AP2 domain regions are underlined. The putative nuclear localizing signal region is underlined with a dotted line. Black and gray shading indicate 100 and 80% conserved amino acid residues, respectively. The names of protein are indicated on the left. (D) Fine-mapping of the SHAT2 locus. The SHAT2 locus was narrowed down to a 9.7-kb region between markers M627 and M636 using 907 homozygous F2 plants and is indicated by a pink arrow. Numbers below the horizontal line are the number of recombinants. (E) SHAT2 structure. Two exons and one intron are represented by yellow boxes and a horizontal line, respectively. The mutation sites in sh4-1 and sh4-2 are indicated by a blue vertical line and a red vertical arrow, respectively. The blue S indicates the site of a 1-bp substitution in sh4-1, and a short horizontal red line indicates the site of a 1-bp insertion in sh4-2. (F) The amino acid sequence comparison of SH4, sh4-1, and sh4-2. Trihelix DNA binding domain regions are underlined. The putative nuclear localizing signal region is underlined with a dotted line. Arrows indicate the mutation site in sh4-1 (blue) and sh4-2 (red). [See online article for color version of this figure.]
Figure 3.
Figure 3.
Genetic Identification of SHAT1. (A) Schematic diagram of SHAT1 RNAi construct. A 426-bp cDNA fragment around the stop codon was used to generate the SHAT1-RNAi construct in the pTCK303 vector. Hyg, hygromycin-resistant gene; LB and RB, left and right borders, respectively; NosT, nopaline synthase terminator; SHAT1, a 426-bp SHAT1 cDNA fragment; Zm Ubi P, maize (Zea mays) ubiquitin promoter. (B) Corresponding relationship between SHAT1 expression profiles and shattering degree in the control plant Kasalath (Kasa) and eight SHAT1-RNAi transgenic plants. Left: Relative expression of SHAT1 revealed by real-time RT-PCR using RNA isolated from panicles on the day of flowering. Error bars indicate ± sd of the mean of three biological samples. Right: Force required to pull off seeds from pedicels at 30 d after flowering when seeds were fully ripened. Error bars indicate ± sd. (C) Longitudinal sections across AZ of Kasalath and RNAi transgenic plants. Arrows indicate the AZ. Bars = 50 μm. (D) Schematic diagram of a T-DNA mutant line, 2B70080. Gray boxes indicate coding regions, black boxes indicate AP2 domains, and white boxes show the 5′ and 3′ UTRs. The triangle represents the T-DNA, which was inserted into the 3′ UTR. Primers F1 and R1 were used for quantitative real-time RT-PCR analyses of SHAT1 transcript levels. F2, RB, and R2 were used for mapping the T-DNA insertion. (E) Genotyping of T2 seedlings. H, heterozygous; M, homozygous; W, Huayong. (F) Comparison of SHAT1 mRNA expression levels and the nonshattering phenotype in Huayong and 2B70080 mutant. Left: Real-time RT-PCR analysis. Error bars indicate ± sd of the mean of three biological samples. Right: BTS measurement of grain pedicel. Error bars indicate ± sd. (G) Longitudinal sections across AZs of Huayong and 2B70080 plants. Arrows indicate the AZ. Bars = 50 μm.
Figure 4.
Figure 4.
Transactivation Tests of SHAT1 in Yeast. The constructs of the plasmids pGBKT7-SHAT1, pGBKT7-SHAT1ΔC, and pGBKT7-SHAT1ΔN are shown on the left. pGBKT7 was used as a negative control, and the known transcription factor Os-bZIP72 was fused with GAL4 BD of pGBKT7 as the positive control. Transactivation analysis of corresponding constructs by yeast one-hybrid was detected on the SD/Trp- and SD/Trp-/His-/0.5 mM 3AT media. GAL4 BD, GAL4 DNA binding domain; MCS, multiple cloning sites. [See online article for color version of this figure.]
Figure 5.
Figure 5.
The Expression Pattern of SHAT1 by Quantitative RT-PCR and GUS Assay. (A) Quantitative RT-PCR results for SHAT1 mRNA in different tissues. L, leaf; P1-P15, panicle of 1 to 15 cm lengths, respectively; S, seedling; Sh, sheath; St, stem. Error bars indicate ± sd of the mean of three biological samples. (B) to (J) GUS expression pattern in the SHAT1pro:GUS transgenic plant. Leaf (B), stem (C), node (D), leaf sheath (E), young panicle (F), and spikelets during different developmental stages (G) to (J). Arrows indicate AZ. Bars = 1 mm.
Figure 6.
Figure 6.
In Situ Hybridization of SHAT1 during Spikelet Developmental Stages Sp6 to Sp8. (A) to (D) The wild type (WT). SHAT1 transcripts began to accumulate in the provisional AZ from stage sp8e (C) and became intense during stage sp8l (D). Longitudinal sections through vascular bundle (1) or deviate from vascular bundle (2) are shown in (D). Sense probe control is shown in Supplemental Figure 7A online. (E) to (H) sh4-1 mutant. SHAT1 exhibited a similar expression pattern to that in the wild type. (I) to (L) sh4-2 mutant. SHAT1 expression was completely disrupted in sh4-2. (M) to (P) shat1 mutant. SHAT1 signals were lost in AZ but retained in anthers (P). The four columns from left to right indicate spikelet developmental stages sp6 to sp8, respectively. sp8e, early stage sp8; sp8l, late stage sp8. Arrows indicate AZ. Bars = 100 μm.
Figure 7.
Figure 7.
In Situ Hybridization of SH4 during Spikelet Developmental Stages Sp6 to Sp8. (A) to (D) The wild type (WT). SH4 transcripts began to accumulate in the provisional AZ from stage sp6 (A) and became obvious in AZ and anthers during stage sp7 (B). More intense signals for SH4 were displayed in early stage sp8 (C) and late stage sp8 (D). Sense probe control is shown in Supplemental Figure 7B online. (E) to (H) sh4-1 mutant. SH4 exhibited a similar expression pattern to that in the wild type. (I) to (L) sh4-2 mutant. SH4 expression was completely disrupted in sh4-2. (M) to (P) shat1 mutant. SH4 signals were present at AZ during stages sp6-sp8e ([M] to [O]) but absent from sp8l onward (P). The four columns from left to right indicate spikelet developmental stages sp6-sp8, respectively. sp8e, early stage sp8; sp8l, late stage sp8. Arrows indicate AZ. Bars = 100 μm.
Figure 8.
Figure 8.
Effect of Persistent and Concentrated Expression of SHAT1 and SH4 on AZ Differentiation. (A) to (D) Expression of SHAT1 in japonica cv Nipponbare. SHAT1 expression gathered in AZ during stage sp8e (C) but absent from the AZ during stage sp8l (D). (E) to (H) Expression of SH4 in japonica cv Nipponbare. SH4 expression emerged in AZ from stage sp6 (E) and remained in the AZ from stage sp7 (F) to stage sp8e (G) but disappeared from the AZ during stage sp8l (H). (I) to (L) Expression of SHAT1 in substitution line N52. SHAT1 expression persisted in the AZ from stage sp8e (K) to sp8l (L). (M) to (P) Expression of SH4 in substitution line N52. SH4 transcripts accumulated in the AZ during stages sp6-sp8l. The four columns from left to right indicate spikelet developmental stages sp6-sp8, respectively. sp8e, early stage sp8; sp8l, late stage sp8. Arrows indicate AZ. Bars = 100 μm.
Figure 9.
Figure 9.
In Situ Hybridization of qSH1. (A) to (E) Expression of qSH1 in wild type (WT) during stages sp6-sp8l. Sense probe as control in (E). (F) to (H) Stage sp8l in different spikelets. No signals for qSH1 were detected in the shat1 spikelet (F) or in the sh4-2 spikelet (G); strong signals for qSH1 were detected in N52 AZs (H). sp8e, early stage sp8; sp8l, late stage sp8. Arrows indicate AZ. Bars = 100 μm.
Figure 10.
Figure 10.
A Genetic Model of Regulatory Network Specifying AZ Development in Rice. The continuous expression of SHAT1 and SH4, regulated by qSH1 or other genetic partners (as shown by the question mark), is necessary for proper AZ development. Long horizontal arrow represents time progression. sp8e, early stage sp8; sp8l, late stage sp8.

Comment in

Similar articles

Cited by

References

    1. Briggs C.L., Morris E.C. (2008). Seed-coat dormancy in Grevillea linearifolia: Little change in permeability to an apoplastic tracer after treatment with smoke and heat. Ann. Bot. (Lond.) 101: 623–632 - PMC - PubMed
    1. Chen X.M. (2004). A microRNA as a translational repressor of APETALA2 in Arabidopsis flower development. Science 303: 2022–2025 - PMC - PubMed
    1. Doebley J. (2006). Plant science. Unfallen grains: How ancient farmers turned weeds into crops. Science 312: 1318–1319 - PubMed
    1. Fuller D.Q., Qin L., Zheng Y.F., Zhao Z.J., Chen X., Hosoya L.A., Sun G.P. (2009). The domestication process and domestication rate in rice: spikelet bases from the Lower Yangtze. Science 323: 1607–1610 - PubMed
    1. Gan Y., Malhi S.S., Brandt S.A., McDonald C.L. (2008). Assessment of seed shattering resistance and yield loss in five oilseed crops. Can. J. Plant Sci. 88: 267–270

Publication types

MeSH terms

LinkOut - more resources