. 2012 Mar;24(3):961-81.
doi: 10.1105/tpc.111.093948. Epub 2012 Mar 9.

Alternative splicing mediates responses of the Arabidopsis circadian clock to temperature changes

Affiliations

Alternative splicing mediates responses of the Arabidopsis circadian clock to temperature changes

Allan B James et al. Plant Cell. 2012 Mar.

Abstract

Alternative splicing plays crucial roles by influencing the diversity of the transcriptome and proteome and regulating protein structure/function and gene expression. It is widespread in plants, and alteration of the levels of splicing factors leads to a wide variety of growth and developmental phenotypes. The circadian clock is a complex piece of cellular machinery that can regulate physiology and behavior to anticipate predictable environmental changes on a revolving planet. We have performed a system-wide analysis of alternative splicing in clock components in Arabidopsis thaliana plants acclimated to different steady state temperatures or undergoing temperature transitions. This revealed extensive alternative splicing in clock genes and dynamic changes in alternatively spliced transcripts. Several of these changes, notably those affecting the circadian clock genes late elongated hypocotyl (LHY) and pseudo response regulator7, are temperature-dependent and contribute markedly to functionally important changes in clock gene expression in temperature transitions by producing nonfunctional transcripts and/or inducing nonsense-mediated decay. Temperature effects on alternative splicing contribute to a decline in LHY transcript abundance on cooling, but LHY promoter strength is not affected. We propose that temperature-associated alternative splicing is an additional mechanism involved in the operation and regulation of the plant circadian clock.


Figures
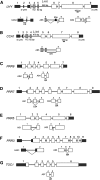
Figure 1.
Figure 1.
Significant Temperature-Associated AS Events. LHY (A), CCA1 (B), PRR9 (C), PRR7 (D), PRR5 (E), PRR3 (F), and TOC1 (G). Gene structures are shown with exons numbered; exons in the 5′ and 3′UTRs are smaller, dark-shaded boxes; coding sequences are larger open boxes, except the Myb-encoding exons of LHY and CCA1, which are shaded gray. AS events that comprise more than 10% of total transcripts or are cold specific are shown below the gene structures. Diagonal lines, splicing event; ES, exon skip (details in Supplemental Data Set 1 online). The vertical dashed line in LHY indicates the start of exon 8 in AS9.
Figure 2.
Figure 2.
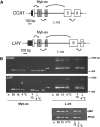
Temperature Modulates AS of CCA1 and LHY. (A) Primers targeting the Myb-ex and L-int regions of CCA1 spanned the splice junctions of exons 2/3 and 4/5 (CCA1 Myb-ex) and exons 3/4 and 5/6 (CCA1 L-int), respectively, as shown by the arrows; the corresponding primers for LHY spanned exons 3/4 and 5/6 (LHY Myb-ex) and exons 4/5 and 6/7 (LHY L-int). (B) Temperature-dependent AS events detected by RT-PCR. Fully or canonically spliced transcript (FS) products are denoted by horizontal arrows in blank lanes. Samples were harvested at dawn in the denoted temperature conditions. Downward arrows denote plants 12 h after temperature had been reduced from 20 to 12°C or 4°C. n, negative control (no primer control). Amplification of UBC (UBC21; At5g25760) and PP2A (PP2AA3; At1g13320) served as transcript level reference genes. The figure is representative of three independent experiments.
Figure 3.
Figure 3.
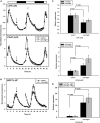
Temperature Alters Expression of CCA1 and LHY. (A) and (B) Expression was measured across a 12:12 h diurnal cycle (black and white bar; dark and light, respectively) for the denoted temperature conditions and normalized relative to the dawn peak level (100%) for plants acclimated to 20°C. Data at time points 9, 12, and 15 h after dusk show the mean and sd (n = 3). (A) Expression of CCA1 and LHY measured by qPCR using primers for the Myb-ex region and a 3′ region as shown. (B) Expression measured by HR RT-PCR using primer sets #398 and #397 for CCA1 and LHY, respectively (see Supplemental Figure 1 online). (C) Immunoblot analysis of CCA1 (left) and LHY (right) protein levels across a diurnal cycle at the denoted temperatures. Protein abundance is expressed relative to the highest value at 20°C.
Figure 4.
Figure 4.
Retention of LHY Intron 1 and Splicing of an Alternative Exon in the LHY Long Intron on Cooling. (A) RT-PCR amplification of LHY transcripts retaining intron 1 using the indicated primers. Top gel: cooling from 20 to 4°C. Boxes are shaded as in Figure 1. The arrow shows the size of the fragment expected for retention of intron 1 but otherwise undergoing canonical splicing. n1,2,3, triplicate samples harvested at dawn under the conditions indicated. UBC and PP2A served as reference genes. Bottom gel: cooling from 20 to 12°C; n1,2, duplicate samples harvested at dawn under the conditions indicated with UBC as reference gene. (B) HR RT-PCR was used to measure the abundance of canonically spliced transcripts (UFS) and those retaining intron 1 (UAS4) in the 5′UTR of LHY across a diurnal cycle at the denoted temperature conditions. Both transcripts were amplified from a single primer set (primer set #355; see Supplemental Figure 1A online). UFS and UAS4 transcripts are expressed relative to total transcript (UAS1, UAS2, UAS3, UAS4, and UFS) at dawn at 20°C. Data at time points 9, 12, and 15 h after dusk represent the mean and sd (n = 3). Black and white bars represent dark and light, respectively. (C) Relative abundances of FS and AS LHY transcripts in Col-0 and upf mutant seedlings assessed using HR RT-PCR. Left, FS and UAS4, harvested at dawn from plants in a 16:8 photoperiod. Right, FS and AS5, harvested 3 h after dawn from plants in a 12:12 photoperiod. Data are means ± sd; n = 3. Asterisks indicate a significant increase relative to the wild type; P < 0.01 by Student’s t test. arb., arbitrary units. (D) Top: AS within the L-int of LHY generating E5a (splicing event AS5; Figure 1A, Table 1). The alternative 3′ and 5′ splice sites are shown; exon sequence, capitals; intron sequence, lowercase. Bottom: Abundance of transcripts containing E5a across a diurnal cycle (black and white bar; dark and light, respectively) for the denoted temperature condition as determined (left) by HR RT-PCR using primer set #292 (see Supplemental Figure 1A online) and (right) by qPCR using primers spanning the novel E5a splice junctions. Data at time points 9, 12, and 15 h after dusk are means ± sd (n = 3). Increases on cooling measured at dawn by qPCR are all significant; P < 0.001.
Figure 5.
Figure 5.
LHY Promoter Strength Is Not Affected by a Cold Night. (A) Imaging started at dusk but the first 12 h are not shown; time 0 represents dawn. Control plants (closed symbols) were kept at 20°C. Plants exposed to a cold night (open symbols) were removed from the imaging chamber at the point indicated by the arrow, placed in the dark at 4°C for 12 h, and then returned to the imaging chamber at 20°C. Luminescence data were not collected during the cold night. Plants expressed either LHY:LUC+ or CCA1:LUC+. Data are means ± se; n = 15 for LHY:LUC+ control plants, and n = 20 for all other conditions. (B) Imaging as in (A); plants expressed GRP7:LUC+. Data are means ± se; n = 5 at 20°C, and n = 7 at 4°C. (C) Plants were harvested at dawn after a night at 20 or 4°C. LHY and CCA1 transcripts were assessed relative to UBC and PP2A by qPCR for ProLHY:LUC+ plants and ProCCA1:LUC+ plants, respectively. Data are means ± se, n = 4, and significance was assessed by Student’s t test. (D) As for (C); LHY E5a transcripts were assessed relative to UBC and PP2A by qPCR for ProLHY:LUC+ plants. Data are means ± se, n = 4, and significance was assessed by Student’s t test.
Figure 6.
Figure 6.
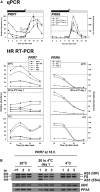
Temperature Alters Expression and AS of PRR7 and PRR9. (A) Top: transcript abundance measured by qPCR across a 12:12-h diurnal cycle (black and white bar; dark and light, respectively) for the denoted temperature condition. Data for 9, 12, 15, 18, 21, and 24 h after dusk represent mean ± sd values (n = 3). Expression levels were normalized relative to the peak values in plants acclimated to 20°C (at 15 and 18 h after dusk for PRR9 and PRR7, respectively). Bottom: relative levels of total and AS transcripts determined by HR RT-PCR over the period 15 to 24 h after dusk in the conditions indicated. Transcripts were amplified using primer set #327 (PRR7) and #170 (PRR9) to identify significant AS events (see Supplemental Figure 2 online). Totals were the sum of the FS and AS transcripts. Expression levels were normalized relative to the peak values of total transcript in plants acclimated to 20°C as above. (B) RT-PCR amplification of PRR7 using primers (see Supplemental Data Set 2 online) to detect AS1 and AS3 during cooling from 20 to 4°C. n1, 2, and 3 refer to triplicate samples taken 18 h after dusk under the conditions indicated, harvested and processed independently. UBC and PP2A served as reference genes.
Figure 7.
Figure 7.
Temperature Alters Expression and AS of TOC1, PRR3, and PRR5. (A) Top: Transcript abundance measured by qPCR across a 12:12-h diurnal cycle (black and white bar; dark and light, respectively) for the denoted temperature condition. Data for 9, 12, 15, 18, 21, and 24 h after dusk represent mean ± sd values (n = 3). Expression levels were normalized relative to the peak values in plants acclimated to 20°C (21 h for each gene). Bottom: Relative levels of total and AS transcripts determined by HR RT-PCR over the period 15 to 24 h after dusk in the conditions indicated. Transcripts were amplified using primer set #174 (TOC1), #374 (PRR3), and #457 (PRR5) to identify significant AS events (see Supplemental Figure 3 online). Totals were the sum of the FS and AS transcripts. Expression levels were normalized relative to the peak values of total transcript in plants acclimated to 20°C as above. (B) and (C) RT-PCR amplification of PRR5 using primers to detect AS3 and of TOC1 using primers to detect AS7 (see Supplemental Data Set 2 online) during cooling from 20 to 4°C. n1, 2, and 3 refer to triplicate samples harvested at 18 h after dusk (PRR5) and 21 h after dusk (TOC1) under the conditions indicated. UBC and PP2A served as reference genes.
Figure 8.
Figure 8.
Temperature Alters Expression and AS of Other Clock Components and Clock Outputs. Transcript abundance was measured by qPCR across a 12:12-h diurnal cycle (black and white bar; dark and light, respectively) at the denoted temperature condition. GI (A), ELF3 (B), and CAB2, CAT3, and GRP7 (CCR2) (C). Data for 9, 12, 15, 18, 21, and 24 h after dusk represent mean and sd values (n = 3). Expression levels were normalized relative to values in plants acclimated to 20°C, at 15 h after dusk for CAB2, and 21 h after dusk for CAT3, GI, ELF3, and CCR2/GRP7.
Figure 9.
Figure 9.
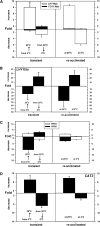
Temperature Increases and Decreases Have Opposite Effects on Both Gene Expression and Splicing. Transcript abundances were measured by qPCR during the first day (left panels) or on the 5th day (right panels) after a temperature shift. For each gene, expression was measured at the time of maximum expression in the starting conditions, and data are expressed as a fold increase or fold decrease relative to the starting values at 4 or 20°C. Data represent mean and sd values (n = 3). (A) Total LHY and CCA1 expression as measured by qPCR of the Myb-ex region. (B) E5a of LHY by qPCR as in Figure 4D. (C) PRR3 and PRR5 expression as in Figure 7A. (D) CAT3 expression as in Figure 8C.

Similar articles

Cited by

References

    1. Akman O.E., Locke J.C., Tang S., Carré I., Millar A.J., Rand D.A. (2008). Isoform switching facilitates period control in the Neurospora crassa circadian clock. Mol. Syst. Biol. 4: 164. - PMC - PubMed
    1. Altschul S.F., Madden T.L., Schäffer A.A., Zhang J., Zhang Z., Miller W., Lipman D.J. (1997). Gapped BLAST and PSI-BLAST: A new generation of protein database search programs. Nucleic Acids Res. 25: 3389–3402 - PMC - PubMed
    1. Alabadí D., Oyama T., Yanovsky M.J., Harmon F.G., Más P., Kay S.A. (2001). Reciprocal regulation between TOC1 and LHY/CCA1 within the Arabidopsis circadian clock. Science 293: 880–883 - PubMed
    1. Arciga-Reyes L., Wootton L., Kieffer M., Davies B. (2006). UPF1 is required for nonsense-mediated mRNA decay (NMD) and RNAi in Arabidopsis. Plant J. 47: 480–489 - PubMed
    1. Barash Y., Calarco J.A., Gao W., Pan Q., Wang X., Shai O., Blencowe B.J., Frey B.J. (2010). Deciphering the splicing code. Nature 465: 53–59 - PubMed

Publication types

LinkOut - more resources