. 2012 May;153(5):2420-35.
doi: 10.1210/en.2011-1783. Epub 2012 Mar 9.

Vitamin D deficiency exacerbates experimental stroke injury and dysregulates ischemia-induced inflammation in adult rats

Affiliations

Vitamin D deficiency exacerbates experimental stroke injury and dysregulates ischemia-induced inflammation in adult rats

Robyn Balden et al. Endocrinology. 2012 May.

Abstract

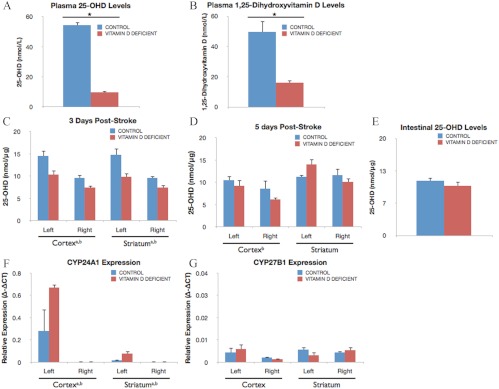
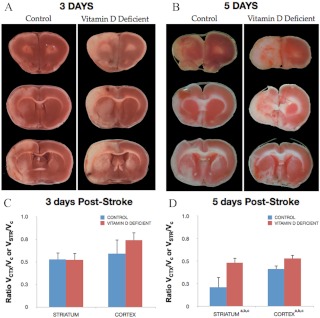
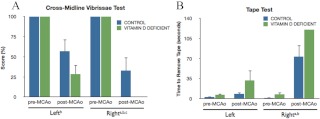
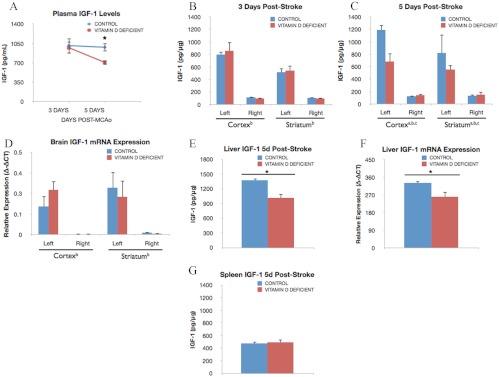
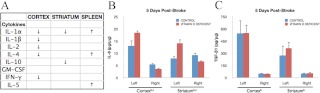
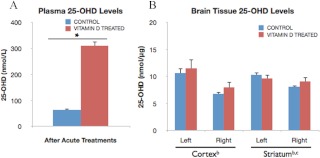
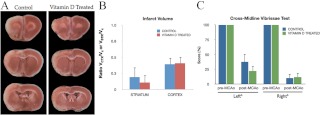
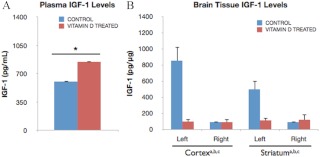
Vitamin D deficiency (VDD) is widespread and considered a risk factor for cardiovascular disease and stroke. Low vitamin D levels are predictive for stroke and more fatal strokes in humans, whereas vitamin D supplements are associated with decreased risk of all-cause mortality. Because VDD occurs with other comorbid conditions that are also independent risk factors for stroke, this study examined the specific effect of VDD on stroke severity in rats. Adult female rats were fed control or VDD diet for 8 wk and were subject to middle cerebral artery occlusion thereafter. The VDD diet reduced circulating vitamin D levels to one fifth (22%) of that observed in rats fed control chow. Cortical and striatal infarct volumes in animals fed VDD diet were significantly larger, and sensorimotor behavioral testing indicated that VDD animals had more severe poststroke behavioral impairment than controls. VDD animals were also found to have significantly lower levels of the neuroprotective hormone IGF-I in plasma and the ischemic hemisphere. Cytokine analysis indicated that VDD significantly reduced IL-1α, IL-1β, IL-2, IL-4, IFN-γ, and IL-10 expression in ischemic brain tissue. However, ischemia-induced IL-6 up-regulation was significantly higher in VDD animals. In a separate experiment, the therapeutic potential of acute vitamin D treatments was evaluated, where animals received vitamin D injections 4 h after stroke and every 24 h thereafter. Acute vitamin D treatment did not improve infarct volume or behavioral performance. Our data indicate that VDD exacerbates stroke severity, involving both a dysregulation of the inflammatory response as well as suppression of known neuroprotectants such as IGF-I.


Figures

Fig. 1.
Fig. 1.
Effect of VDD diet on circulating and local 1,25-OH2D and 25-OH vitamin D levels. A and B, Vitamin D levels were measured in plasma from animals fed a VDD diet or a control diet for 8 wk. The VDD diet significantly reduced circulating vitamin D (25-OHD) levels to 22% of observed levels in rats fed control chow (*, P < 0.05) (A) and circulating activated vitamin D (1,25-OH2D) levels to less than 33% of control levels (*, P < 0.05) (B), respectively. Histograms depict mean ± sem. C, Brain levels of 25-OH vitamin D. Vitamin D was measured in lysates from the ischemic (left) and nonischemic (right) hemisphere at d 3 after MCAo surgery. Vitamin D levels were significantly higher in tissues from control diet-fed animals as compared with VDD diet animals (a, Main effect of diet). Ischemia elevated 25-OHD levels in both the cortex and striatum at 3 d (b, Main effect of ischemia). D, At 5 d after MCAo, there were no significant differences in vitamin D levels in brain tissue derived from VDD diet animals vs. controls. In the ischemic cortex, vitamin D levels remained elevated above nonischemic levels at 5 d after stroke but not in the striatum. E, Small intestine 25-OHD levels. Vitamin D levels were measured in the intestine, an unrelated tissue classically associated with vitamin D, for comparison with brain tissue measurements. As in the brain, VDD diet did not significantly affect intestinal 25-OHD levels. F and G, Expression of genes coding for vitamin D metabolic deactivating CYP24A1 and activating CYP27B1 enzymes was quantified in brain tissue at 5 d. F, CYP24A1 expression was significantly increased in animals fed VDD diet in the ischemic cortex and striatum (a, Main effect of diet). Injury further resulted in greater elevation of CYP24A1 in the ischemic hemisphere of both groups as compared with nonischemic tissues (b, Main effect of ischemia). G, No significant differences were found in CYP27B1 expression levels. Data were analyzed by two-way ANOVA for diet treatment and ischemia for each region; a, Main effect of diet; b, main effect of ischemia. Group differences were considered significant at P ≤ 0.05. Bars represent mean ± sem; n = 4–7 in each group.
Fig. 2.
Fig. 2.
Effect of VDD diet on infarct volume. Animals maintained on a VDD diet or control diet were subject to MCAo and euthanized 3 or 5 d later. Representative slices of TTC-stained sections depict the rostrocaudal extent of the infarct in control and VDD animals 3 d (A) and 5 d (B) after ischemia. Unstained tissue is indicative of dead or infarcted tissue. Histograms depict mean ± sem of infarct volume in the cortex and striatum normalized to the contralateral side. C, At d 3, there were no significant differences in cortical or striatal infarct volume between the control diet and VDD animals. D, By 5 d after stroke, both cortical and striatal infarct volumes were significantly larger in the VDD group compared with the control diet-fed animals (a, Main effect of diet). Striatal volumes were more severely affected by VDD (c, Interaction effect of diet treatment and ischemia). Data were analyzed by two-way ANOVA for diet treatment and ischemia for each region; a, Main effect of diet; b, main effect of ischemia; c, interaction effect of diet treatment and ischemia. Group differences were considered significant at P ≤ 0.05. Bars represent mean ± sem; n = 4–7 in each group. Vctx, Volume cortex; Vstr, volume striatum; Vc, volume contralateral hemisphere.
Fig. 3.
Fig. 3.
Effect of VDD diet on behavioral performance. All animals were assessed before and 3 d after stroke on two behavioral tasks. A, Histograms depict mean (±sem) percent correct responses on the cross-midline vibrissae-elicited forelimb placement task, pre- and postischemia. Performance on the left (ipsilesional) limb and right (contralesional) limb was significantly affected by ischemia (b, Main effect of ischemia). However, on the right limb, VDD diet treatment (green bar) significantly worsened performance after stroke compared with the control diet (blue bar) (c, Interaction effect of ischemia and diet). B, Tape test. Histograms depict mean (±sem) duration (in seconds) to remove tape from the palmar surface of the front limb. Performance on this task was significantly impaired after stroke compared with prestroke in both diet groups (b, Main effect of ischemia). Moreover, mean duration to remove the tape was also affected by diet, such that VDD diet groups took longer to remove the tape, or did not remove it at all during the allotted time, compared with the control diet animals (a, Main effect of diet). Data were analyzed by two-way ANOVA for pre-/postischemia and diet treatment for each limb; a, Main effect of diet; b, main effect of ischemia; c, interaction effect of diet treatment and ischemia. Group differences were considered significant at P ≤ 0.05. Bars represent mean ± sem; n = 6–7 in each group.
Fig. 4.
Fig. 4.
Effect of VDD diet on circulating and local IGF-I. A, Plasma IGF-I levels were measured at 3 and 5 d after ischemia in control and VDD female rats. At 3 d after stroke, plasma IGF-I levels were similar in VDD and control groups. However, by 5 d after stroke, IGF-I levels were sustained in control diet animals, whereas peptide levels were decreased in the VDD diet group. Thus, circulating IGF-I levels were reduced 38.5% of the levels observed in control chow-fed animals (*, P < 0.05). Data points represent mean ± sem. B, IGF-I levels in the brain 3 d after ischemia in VDD and control animals. Lysates from the ischemic (left) hemisphere had significantly greater IGF-I expression compared with the nonischemic (right) hemisphere (b, Main effect of ischemia). Diet did not affect IGF-I levels in either the cortex or striatum at 3 d after ischemia. C, At 5 d after ischemia, local IGF-I levels were still elevated in the ischemic hemisphere compared with the ischemic side (b). However, at 5 d after stroke, IGF-I levels were significantly elevated in the cortex and striatum of control animals compared with VDD animals (c, Interaction effect of diet treatment and ischemia). VDD attenuated IGF-I levels in ischemic cortical (75.5%) and striatal (47.2%) tissues. D, IGF-I mRNA expression in the brain 5 d after stroke. Similar to IGF-I protein, IGF-I mRNA levels were significantly greater in the ischemic hemisphere (b). However, diet did not affect IGF-I mRNA levels in the cortex or striatum. E and F, Liver expression of IGF-I. At 5 d after ischemia, IGF-I protein (E) and mRNA (F) levels were significantly reduced (35.14 and 28.0%, respectively) in VDD liver tissue as compared with liver from controls (*, P < 0.05). Data points represent mean ± sem. For comparison, IGF-I levels in the spleen, a peripheral lymphoid organ known to respond to hypoxia, are shown 5 d after stroke. G, Unlike liver tissue, splenic IGF-I levels were not affected by diet. Data were analyzed by three-way ANOVA for diet treatment, ischemia, and region as repeated measures; a, Main effect of diet; b, main effect of ischemia; c, interaction effect of diet treatment and ischemia. Group differences were considered significant at P ≤ 0.05. Bars represent mean ± sem; n = 4–7 in each group.
Fig. 5.
Fig. 5.
Postischemia brain and spleen cytokine expression in control and VDD rats. Brain samples from the ischemic (left) hemisphere and nonischemic (right) hemisphere were collected at d 5 after MCAo and analyzed for cytokine/chemokine expression. A, Arrows indicate the direction of significant changes in expression in specific cytokines in VDD animals relative to controls (P ≤ 0.05). B, At 5 d after stroke, IL-6 levels were significantly higher in the ischemic cortex and striatum compared with the nonischemic side (b, Main effect of ischemia). Furthermore, VDD resulted in a greater elevation of IL-6 in both the cortex (1.21-fold) and striatum (1.51-fold) compared with controls (c, Interaction effect of diet treatment and ischemia). C, At 5 d after stroke, TGF-β1 levels were significantly higher in the ischemic cortex and striatum compared with the nonischemic side (b, Main effect of ischemia). Data were analyzed by two-way ANOVA for diet treatment and ischemia; for each region; b, Main effect of ischemia; c, interaction effect of diet treatment of ischemia. Group differences were considered significant at P ≤ 0.05. Bars represent mean ± sem; n = 4–7 in each group. GM-CSF, Granulocyte-macrophage colony stimulating factor.
Fig. 6.
Fig. 6.
Levels of plasma and brain 25-OH vitamin D levels after vitamin D3 injections. Plasma and brain tissue was derived from control and vitamin D-treated female rats after five consecutive days of vehicle or vitamin D3 + vehicle ip injections, respectively. Samples were collected at 5 d after ischemia. A, Vitamin D treatments significantly increased circulating vitamin D, 25-OHD, levels (3.9-fold) as compared with levels in control rats injected with vehicle alone (*, P < 0.05). Bars represent mean ± sem. B, Brain 25-OHD levels, however, were not significantly affected by acute ip vitamin D3 treatments. There was a small but significant elevation of 25-OHD in ischemic tissues compared with nonischemic tissues. Additionally, in the striatum, 25-OHD levels were affected by an interaction of vitamin D treatment and ischemia, such that 25-OHD levels in the ischemic striatum were significantly higher in the control group compared with the vitamin D-treated animals. Data were analyzed by two-way ANOVA for hormone treatment and ischemia for each brain region; b, Main effect of ischemia; c, interaction effect of ischemia and hormone treatment. Bars represent mean ± sem; n = 4–5 in each group.
Fig. 7.
Fig. 7.
Effect of vitamin D3 injections on infarct volume. Animals were subject to MCAo and euthanized 5 d later. A, Representative slices of TTC-stained sections depict the rostrocaudal extent of the infarct in control and vitamin D3-treated animals. B, Histograms depict infarct volume normalized to the contralateral side. Infarct volume was not affected by acute vitamin D3 treatment in the cortex or the striatum. Bars represent mean ± sem. C, Performance on sensory motor task before and after ischemia. Animals were tested before and after ischemia on the vibrissae-evoked forelimb placement task. Histogram depicts mean (±sem) correct responses on the cross-midline vibrissae-elicited forelimb placement task for each forelimb. Postischemic performance was significantly affected on the left and right limb. However, vitamin D3 treatment had no affect on the performance of either limb. Data were analyzed by two-way ANOVA for pre-/postischemia and vitamin D3 treatment; b, Main effect of ischemia. Group differences were considered significant at P ≤ 0.05; n = 4–5 in each group.Vctx, Volume cortex; Vstr, volume striatum; Vc, volume contralateral hemisphere.
Fig. 8.
Fig. 8.
Effect of vitamin D3 injections on plasma and brain IGF-I levels. Plasma and brain tissue derived from control and vitamin D-treated female rats 5 d after stroke were analyzed for IGF-I expression. A, Vitamin D treatments significantly increased circulating IGF-I levels (39.5%) as compared with levels in control rats injected with vehicle alone (*, P < 0.05). Bars represent mean ± sem. B, IGF-I levels were elevated in the ischemic cortex and striatum, but this was only seen in the controls and not the vitamin D3-treated animals. Thus, IGF-I levels were significantly lower in the ischemic cortex (11.5-fold) and striatum (3.4-fold) of hormone-treated animals. Data were analyzed by two-way ANOVA for hormone treatment and ischemia for each brain region; a, Main effect of hormone treatment; b, main effect of ischemia; c, interaction effect of hormone and ischemia. Group differences were considered significant at P < 0.05. Bars represent mean ± sem; n = 4–5 in each group.

References

    1. Baeke F, Gysemans C, Korf H, Mathieu C. 2010. Vitamin D insufficiency: implications for the immune system. Pediatr Nephrol 25:1597–1606 - PubMed
    1. Bouillon R, Carmeliet G, Verlinden L, van Etten E, Verstuyf A, Luderer HF, Lieben L, Mathieu C, Demay M. 2008. Vitamin D and human health: lessons from vitamin D receptor null mice. Endocr Rev 29:726–776 - PMC - PubMed
    1. Chen S, Sims GP, Chen XX, Gu YY, Chen S, Lipsky PE. 2007. Modulatory effects of 1,25-dihydroxyvitamin D3 on human B cell differentiation. J Immunol 179:1634–1647 - PubMed
    1. Haussler MR, Haussler CA, Whitfield GK, Hsieh JC, Thompson PD, Barthel TK, Bartik L, Egan JB, Wu Y, Kubicek JL, Lowmiller CL, Moffet EW, Forster RE, Jurutka PW. 2010. The nuclear vitamin D receptor controls the expression of genes encoding factors which feed the “fountain of youth” to mediate healthful aging. J Steroid Biochem Mol Biol 121:88–97 - PMC - PubMed
    1. Bikle DD. 2009. Vitamin D and immune function: understanding common pathways. Curr Osteoporos Rep 7:58–63 - PubMed

Publication types

MeSH terms