

Transcriptome-wide analysis of small RNA expression in early zebrafish development
- PMID: 22408181
- PMCID: PMC3334700
- DOI: 10.1261/rna.029090.111
Transcriptome-wide analysis of small RNA expression in early zebrafish development
Abstract
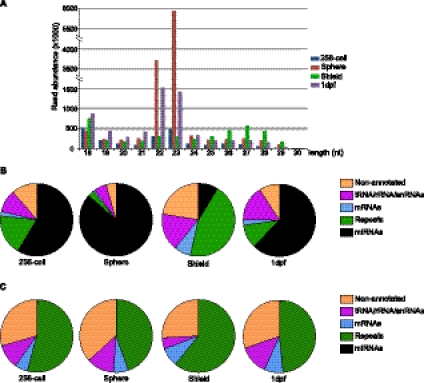
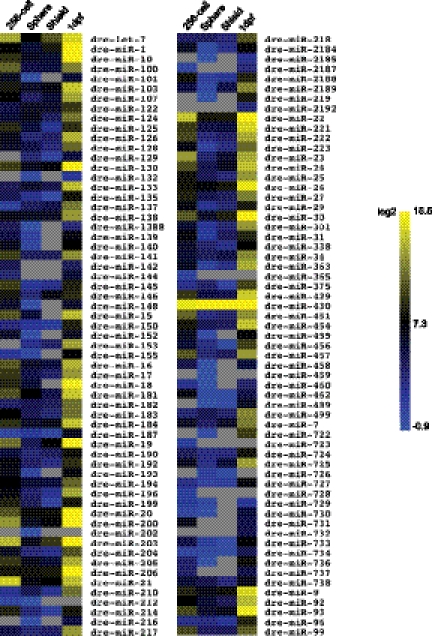
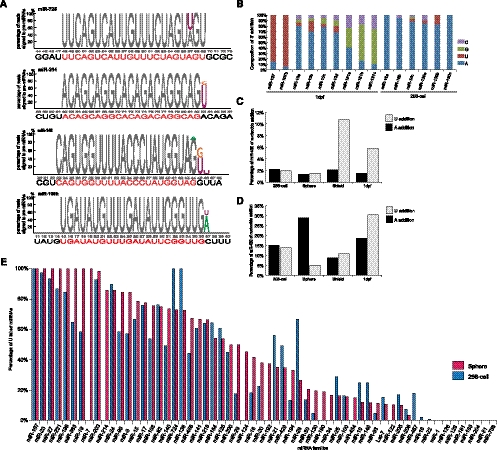
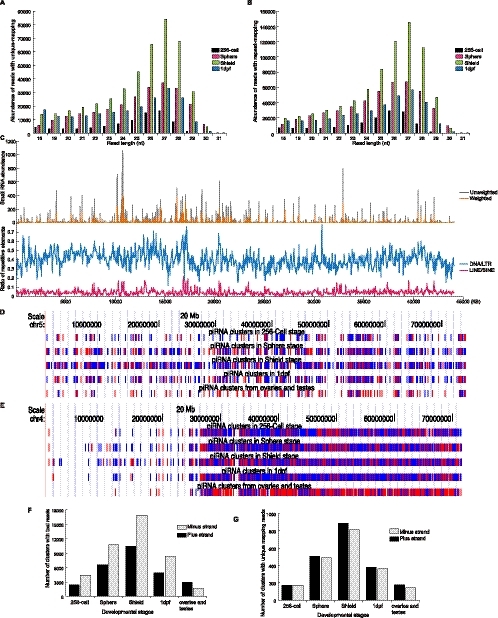
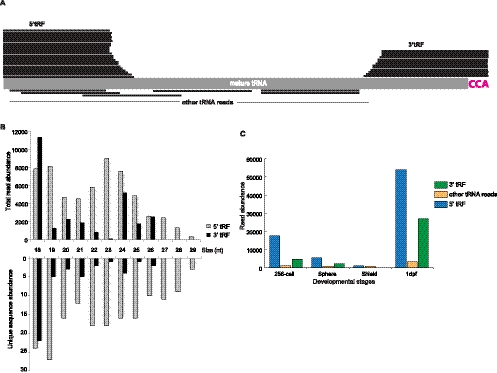
During early vertebrate development, a large number of noncoding RNAs are maternally inherited or expressed upon activation of zygotic transcription. The exact identity, expression levels, and function for most of these noncoding RNAs remain largely unknown. miRNAs (microRNAs) and piRNAs (piwi-interacting RNAs) are two classes of small noncoding RNAs that play important roles in gene regulation during early embryonic development. Here, we utilized next-generation sequencing technology to determine temporal expression patterns for both miRNAs and piRNAs during four distinct stages of early vertebrate development using zebrafish as a model system. For miRNAs, the expression patterns for 198 known miRNAs within 122 different miRNA families and eight novel miRNAs were determined. Significant sequence variation was observed at the 5' and 3'ends of miRNAs, with most extra nucleotides added at the 3' end in a nontemplate directed manner. For the miR-430 family, the addition of adenosine and uracil residues is developmentally regulated and may play a role in miRNA stability during the maternal zygotic transition. Similar modification at the 3' ends of a large number of miRNAs suggests widespread regulation of stability during early development. Beside miRNAs, we also identified a large and unexpectedly diverse set of piRNAs expressed during early development.
Figures
Similar articles
-
Systematic characterization of small RNAome during zebrafish early developmental stages.BMC Genomics. 2014 Feb 10;15:117. doi: 10.1186/1471-2164-15-117. BMC Genomics. 2014. PMID: 24507755 Free PMC article.
-
miR-34 is maternally inherited in Drosophila melanogaster and Danio rerio.Nucleic Acids Res. 2013 Apr;41(8):4470-80. doi: 10.1093/nar/gkt139. Epub 2013 Mar 6. Nucleic Acids Res. 2013. PMID: 23470996 Free PMC article.
-
Reciprocal regulation of miRNAs and piRNAs in embryonic development.Cell Death Differ. 2016 Sep 1;23(9):1458-70. doi: 10.1038/cdd.2016.27. Epub 2016 Mar 18. Cell Death Differ. 2016. PMID: 26990662 Free PMC article.
-
Widespread roles of microRNAs during zebrafish development and beyond.Dev Growth Differ. 2012 Jan;54(1):55-65. doi: 10.1111/j.1440-169X.2011.01306.x. Epub 2011 Dec 12. Dev Growth Differ. 2012. PMID: 22150108 Review.
-
[Regulation of zebrafish development by microRNAs].Yi Chuan. 2011 Nov;33(11):1179-84. doi: 10.3724/sp.j.1005.2011.01179. Yi Chuan. 2011. PMID: 22120072 Review. Chinese.
Cited by
-
RNA sequencing reveals small RNAs differentially expressed between incipient Japanese threespine sticklebacks.BMC Genomics. 2013 Apr 2;14:214. doi: 10.1186/1471-2164-14-214. BMC Genomics. 2013. PMID: 23547919 Free PMC article.
-
miR-153 regulates SNAP-25, synaptic transmission, and neuronal development.PLoS One. 2013;8(2):e57080. doi: 10.1371/journal.pone.0057080. Epub 2013 Feb 25. PLoS One. 2013. PMID: 23451149 Free PMC article.
-
Transcriptional quiescence in primordial germ cells.Crit Rev Biochem Mol Biol. 2018 Dec;53(6):579-595. doi: 10.1080/10409238.2018.1506733. Epub 2018 Oct 3. Crit Rev Biochem Mol Biol. 2018. PMID: 30280955 Free PMC article. Review.
-
Global analyses of the dynamics of mammalian microRNA metabolism.Genome Res. 2019 Nov;29(11):1777-1790. doi: 10.1101/gr.251421.119. Epub 2019 Sep 13. Genome Res. 2019. PMID: 31519739 Free PMC article.
-
Diverse RNA interference strategies in early-branching metazoans.BMC Evol Biol. 2018 Nov 1;18(1):160. doi: 10.1186/s12862-018-1274-2. BMC Evol Biol. 2018. PMID: 30382896 Free PMC article.
References
Publication types
MeSH terms
Substances
Associated data
- Actions
Grants and funding
LinkOut - more resources
Full Text Sources
Molecular Biology Databases