

The brain's supply and demand in obesity
- PMID: 22408618
- PMCID: PMC3297086
- DOI: 10.3389/fnene.2012.00004
The brain's supply and demand in obesity
Abstract
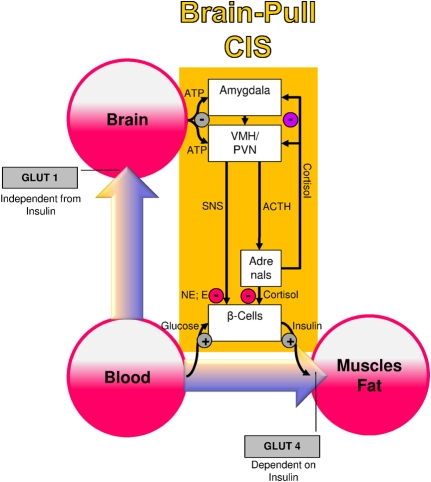
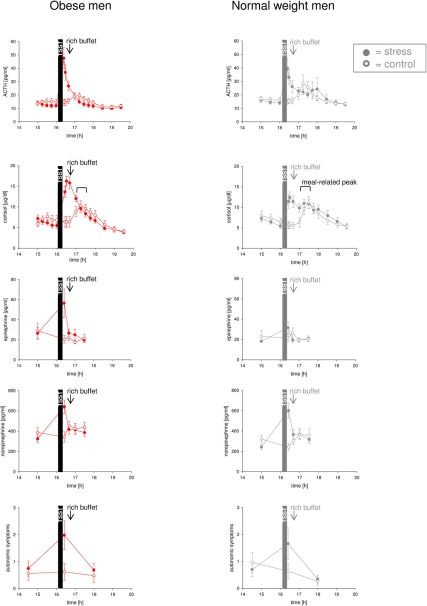
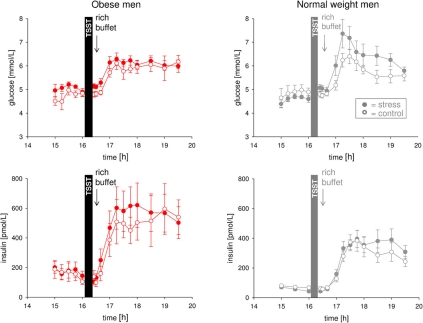
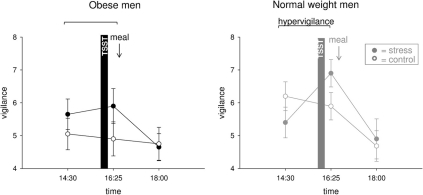
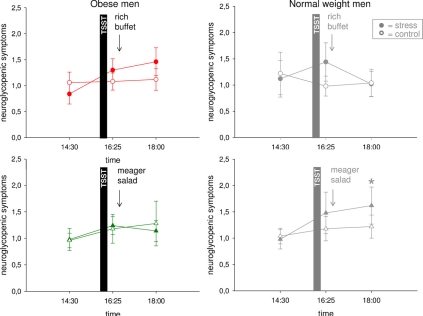
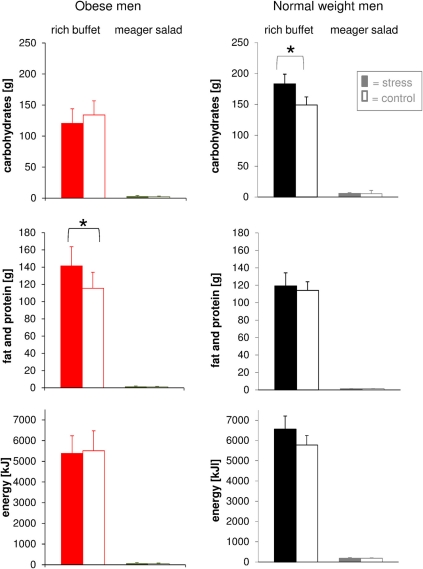
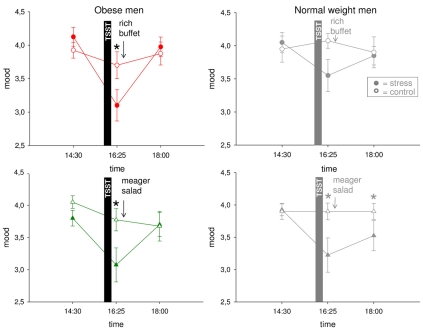
During psychosocial stress, the brain demands extra energy from the body to satisfy its increased needs. For that purpose it uses a mechanism referred to as "cerebral insulin suppression" (CIS). Specifically, activation of the stress system suppresses insulin secretion from pancreatic beta-cells, and in this way energy-particularly glucose-is allocated to the brain rather than the periphery. It is unknown, however, how the brain of obese humans organizes its supply and demand during psychosocial stress. To answer this question, we examined 20 obese and 20 normal weight men in two sessions (Trier Social Stress Test and non-stress control condition followed by either a rich buffet or a meager salad). Blood samples were continuously taken and subjects rated their vigilance and mood by standard questionnaires. First, we found a low reactive stress system in obesity. While obese subjects showed a marked hormonal response to the psychosocial challenge, the cortisol response to the subsequent meal was absent. Whereas the brains of normal weight subjects demanded for extra energy from the body by using CIS, CIS was not detectable in obese subjects. Our findings suggest that the absence of CIS in obese subjects is due to the absence of their meal-related cortisol peak. Second, normal weight men were high reactive during psychosocial stress in changing their vigilance, thereby increasing their cerebral energy need, whereas obese men were low reactive in this respect. Third, normal weight subjects preferred carbohydrates after stress to supply their brain, while obese men preferred fat and protein instead. We conclude that the brain of obese people organizes its need, supply, and demand in a low reactive manner.
Keywords: brain metabolism; brain-pull; cerebral insulin suppression; experimental human study; obesity; selfish brain theory; stress.
Figures
Similar articles
-
How the selfish brain organizes its supply and demand.Front Neuroenergetics. 2010 Jun 9;2:7. doi: 10.3389/fnene.2010.00007. eCollection 2010. Front Neuroenergetics. 2010. PMID: 20616886 Free PMC article.
-
Rise of ketone bodies with psychosocial stress in normal weight men.Psychoneuroendocrinology. 2014 Jul;45:43-8. doi: 10.1016/j.psyneuen.2014.03.008. Epub 2014 Mar 28. Psychoneuroendocrinology. 2014. PMID: 24845175 Clinical Trial.
-
The selfish brain: stress and eating behavior.Front Neurosci. 2011 May 30;5:74. doi: 10.3389/fnins.2011.00074. eCollection 2011. Front Neurosci. 2011. PMID: 21660101 Free PMC article.
-
The selfish brain: Competition for energy resources.Am J Hum Biol. 2011 Jan-Feb;23(1):29-34. doi: 10.1002/ajhb.21106. Am J Hum Biol. 2011. PMID: 21080380 Review.
-
Clinical aspects of leptin.Vitam Horm. 1998;54:1-30. doi: 10.1016/s0083-6729(08)60919-x. Vitam Horm. 1998. PMID: 9529971 Review.
Cited by
-
Altered motivation masks appetitive learning potential of obese mice.Front Behav Neurosci. 2014 Oct 30;8:377. doi: 10.3389/fnbeh.2014.00377. eCollection 2014. Front Behav Neurosci. 2014. PMID: 25400563 Free PMC article.
-
Sex differences in estimated brain metabolism in relation to body growth through adolescence.J Cereb Blood Flow Metab. 2019 Mar;39(3):524-535. doi: 10.1177/0271678X17737692. Epub 2017 Oct 26. J Cereb Blood Flow Metab. 2019. PMID: 29072856 Free PMC article.
-
The corpulent phenotype-how the brain maximizes survival in stressful environments.Front Neurosci. 2013 Apr 2;7:47. doi: 10.3389/fnins.2013.00047. eCollection 2013. Front Neurosci. 2013. PMID: 23565074 Free PMC article.
-
From the past to future: from energy expenditure to energy intake to energy expenditure.Eur J Clin Nutr. 2017 Mar;71(3):358-364. doi: 10.1038/ejcn.2016.231. Epub 2016 Nov 30. Eur J Clin Nutr. 2017. PMID: 27901032 Free PMC article. Review.
-
Amygdalar Metabolic Activity Independently Associates With Progression of Visceral Adiposity.J Clin Endocrinol Metab. 2019 Apr 1;104(4):1029-1038. doi: 10.1210/jc.2018-01456. J Clin Endocrinol Metab. 2019. PMID: 30383236 Free PMC article.
References
-
- Allison S. P., Hinton P., Chamberlain M. J. (1968). Intravenous glucose-tolerance, insulin, and free-fatty-acid levels in burned patients. Lancet 2, 1113–1116 - PubMed
-
- Azarbayjani M. A., Vaezepor F., Rasaee M. J., Tojaril F., Pournemati P., Jourkesh M., Ostojic S. M., Stannard S. R. (2011). Daily timing of salivary cortisol responses and aerobic performance in lean and obese active females. Bratisl. Lek. Listy 112, 213–217 - PubMed
LinkOut - more resources
Full Text Sources