. 2012 Mar 12:10:10.
doi: 10.1186/1477-3155-10-10.

Gold nanoparticles as high-resolution X-ray imaging contrast agents for the analysis of tumor-related micro-vasculature

Affiliations

Gold nanoparticles as high-resolution X-ray imaging contrast agents for the analysis of tumor-related micro-vasculature

Chia-Chi Chien et al. J Nanobiotechnology. .

Abstract

Background: Angiogenesis is widely investigated in conjunction with cancer development, in particular because of the possibility of early stage detection and of new therapeutic strategies. However, such studies are negatively affected by the limitations of imaging techniques in the detection of microscopic blood vessels (diameter 3-5 μm) grown under angiogenic stress. We report that synchrotron-based X-ray imaging techniques with very high spatial resolution can overcome this obstacle, provided that suitable contrast agents are used.

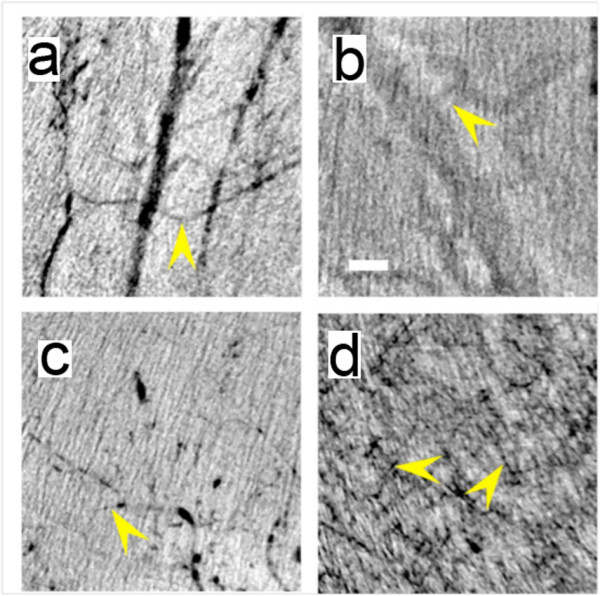
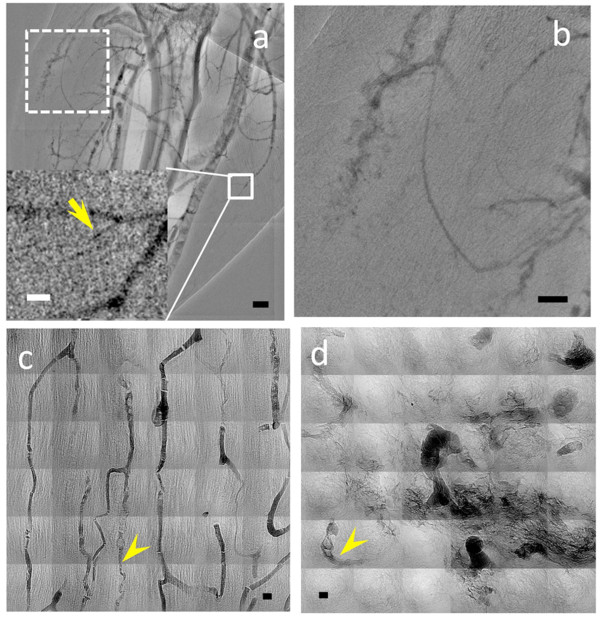
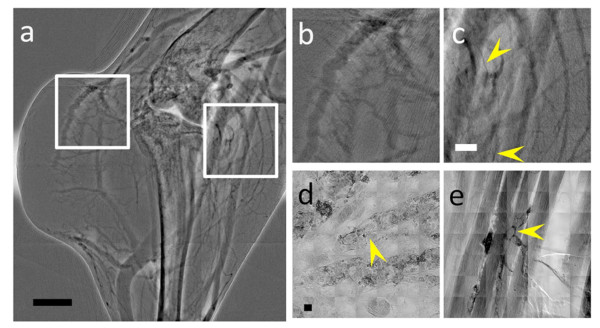
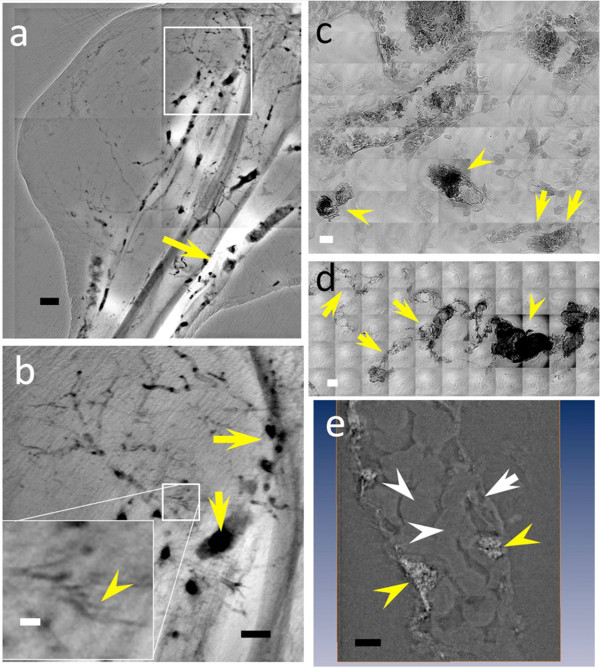
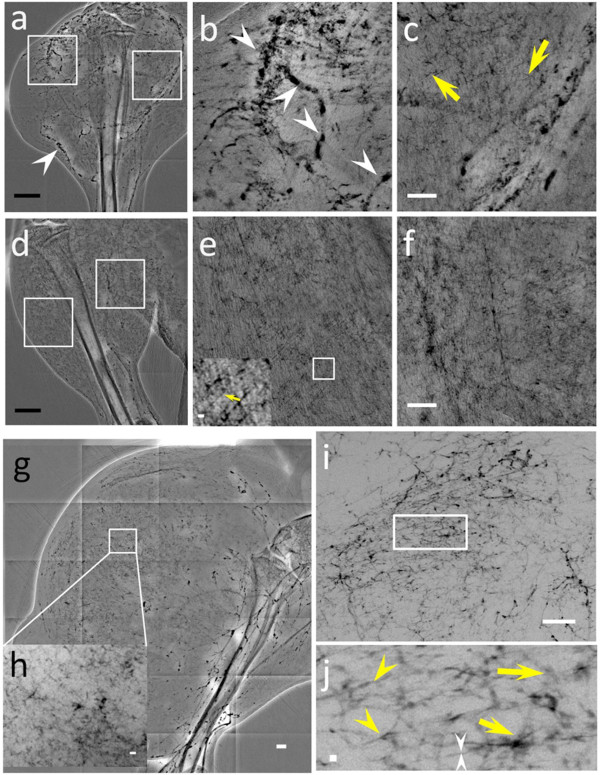
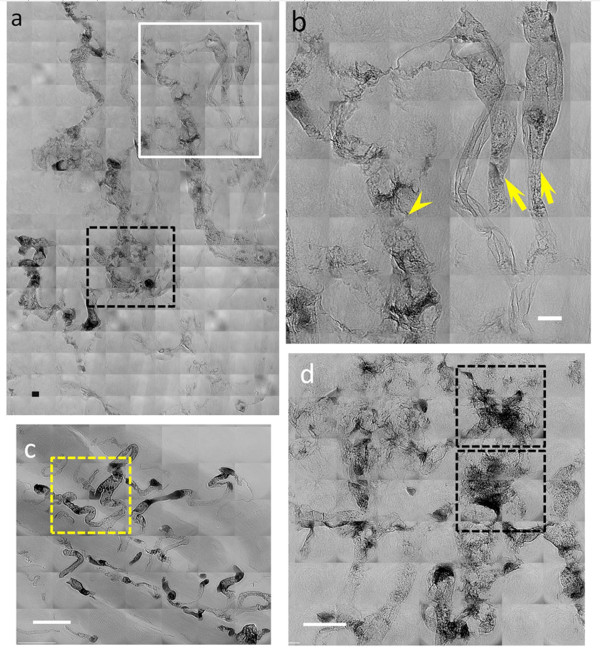
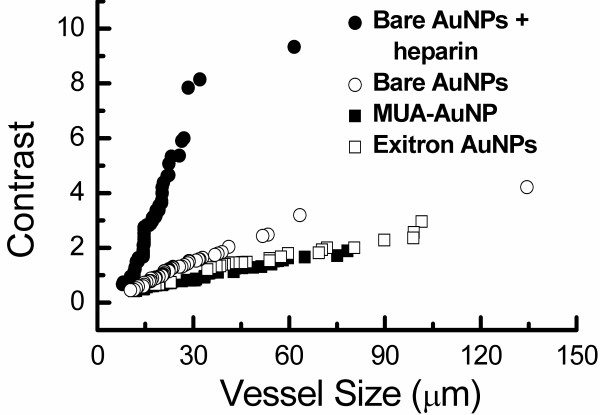
Results: We tested different contrast agents based on gold nanoparticles (AuNPs) for the detection of cancer-related angiogenesis by synchrotron microradiology, microtomography and high resolution X-ray microscopy. Among them only bare-AuNPs in conjunction with heparin injection provided sufficient contrast to allow in vivo detection of small capillary species (the smallest measured lumen diameters were 3-5 μm). The detected vessel density was 3-7 times higher than with other nanoparticles. We also found that bare-AuNPs with heparin allows detecting symptoms of local extravascular nanoparticle diffusion in tumor areas where capillary leakage appeared.

Conclusions: Although high-Z AuNPs are natural candidates as radiology contrast agents, their success is not guaranteed, in particular when targeting very small blood vessels in tumor-related angiography. We found that AuNPs injected with heparin produced the contrast level needed to reveal--for the first time by X-ray imaging--tumor microvessels with 3-5 μm diameter as well as extravascular diffusion due to basal membrane defenestration. These results open the interesting possibility of functional imaging of the tumor microvasculature, of its development and organization, as well as of the effects of anti-angiogenic drugs.


Figures

Figure 1
Figure 1
Direct comparison of the performances of the different tested types of AuNPs in imaging very small vessels. in vivo X-ray micrographs taken in the leg region with (a) MUA-coated AuNPs, (b) commercial ExiTron® Nano 6000, (c) bare-AuNPs and (d) bare-AuNPs with heparin. All images in our study were taken immediately after the corresponding injections. The arrows mark the smallest observable vessels: the measured diameters are 20 μm in (a), 88 in (b), 15 in (c) and 6 in (d). The scale bar of Figure 1b, 200 μm, is valid for all four panels
Figure 2
Figure 2
X-ray micrographs of the microvasculature of the leg area of a tumor bearing mouse taken after injection of MUA-coated AuNP. In vivo snapshots like (a) were taken from a sequence of microradiology images 5 min after the injection; the vessel size marked by the arrow in the inset is ~10 μm. (b) Magnified images of the dotted-line square portion of (a) showing a region of extravascular diffusion of the contrast agent. The scale bars are (a) 500 μm, (b) 250 μm, inset in (a) 50 μm. (c) and (d) are high resolution X-ray microscopy images of MUA-coated AuNPs in muscle and in tumor microvessels. Some microvessels with rather small diameter, ~3 μm, are marked by arrowheads. Substantial extravascular diffusion is found in tumor area. The scale bar in (c) and (d) is 5 μm
Figure 3
Figure 3
X-ray micrographs of the microvasculature of the leg area of a tumor bearing mouse, taken with the ExiTron® Nano 6000 contrast agent. (a) is an in vivo microradiology image taken 4 min after the agent injection. (b) and (c) are magnified images of the square regions in (a) corresponding to a tumor area (b) and to a normal tissue area (c). Some small vessels of diameter ~23 μm are marked by the arrowheads. (d) and (e) are high resolution X-ray images showing microvessels in subcutaneous tissue and muscle vessels The arrowheads mark examples of the smallest vessels, ~20 μm in (d) and ~8 μm in (e). Scale bars: 1 mm (a), 500 μm (b and c) and 10 μm (d and e)
Figure 4
Figure 4
(a) and (b) are in vivo X-ray micrographs of the microvasculature of the leg region of a mouse taken with bare-AuNPs. The smallest detected microvessel has ~8.6 μm diameter, marked by the yellow arrowhead in the inset of (b). Note that the AuNP distribution in the vessels is not continuous. The yellow arrows emphasize that the nanoparticles aggregated in the vessel into large clusters, eventually blocking the flux. (c), (d) and (e) are high resolution X-ray images of vessels in subcutaneous tissue partially coated by bare-AuNPs. Yellow arrowheads indicate agglomerated AuNPs, the white arrow marks an endothelial cell nucleus and the white arrowheads mark erythrocytes in the vessels. Most of the bare-AuNPs adhere to vessel walls and do not interact with erythrocytes. The scale bars are (a) 500 μm, (b) 250 μm (inset 50 μm) (c) and (d) 10 μm and (e) 2.5 μm
Figure 5
Figure 5
X-ray micrographs showing the microvasculature of normal tissue and tumors at different time after the tumor inoculation, taken with bare-AuNPs and heparin injection. (a) In vivo image of the lateral thigh, 7 days after inoculation. (b) and (c) magnified images of the left square in (a), near the tumor area, and of the right square, corresponding to normal tissue area (medial thigh). The arrowheads in (a) and (b) mark vessels showing AuNP agglomeration while the yellow arrows mark vessels of < 6 μm diameter. (d) In vivo image of the normal lateral thigh. (e) and (f) magnified images the left and right squares in (d). The inset in the lower left corner of (e) is an additionally magnified image of its small square and the yellow arrow marks a < 6 μm diameter vessel. (g) In vivo image of the lateral thigh, 16 days after inoculation. (h) magnified image of the square in (g). (i) image of a 1 mm thick tissue removed from the thigh shown in (g). (j) Magnified image of the rectangle in (i); the yellow arrowheads mark abnormal vessels, the white arrowheads a vessel with ~2 μm diameter and the yellow arrows areas with diffusion of bare-AuNPs. Scale bars: (a), (d) and (g): 2 mm; (b), (c), (e), (f), and (i): 500 μm; inset of (e) and (h): 50 μm and (j): 10 μm
Figure 6
Figure 6
High resolution X-ray images of a 7 day tumor in a mouse after heparin treatment and bare-AuNP injection. (a), (b) and (d) are images taken from subcutaneous tumor areas whereas (c) refers to a normal tissue region. The two arrows in (b) mark the normal vessels; the arrowhead marks tumor vessels that show extravascular diffusion of the bare-AuNPs. (d) shows abnormal microvasculature, especially in the two marked squares, with bare-AuNPs diffused out of the microvessles. Scale bars: 10 μm (a and b) and 25 μm (c and d)
Figure 7
Figure 7
Plots of the contrast C-parameter (defined in the text) vs the vessel diameter extracted from in vivo images for the different investigated cases. It is clear that bare-AuNPs with heparin lead to the detection of smaller vessels than the other AuNP species

Similar articles

Cited by

References

    1. Meuli R, Hwu Y, Je JH, Margaritondo G. Synchrotron radiation in radiology--part II: radiology techniques based on synchrotron sources. Eur Radiol. 2004;14:1550–1560. - PubMed
    1. Hwu Y, Tsai WL, Je JH, Seol SK, Bora K. et al.Synchrotron microangiography with no contrast agent. Phys Med Biol. 2004;49:501–508. doi: 10.1088/0031-9155/49/4/002. - DOI - PubMed
    1. Chien CC, Wang CH, Wang CL, Li ER, Lee KH. et al.Synchrotron microangiography studies of angiogenesis in mice with microemulsions and gold nanoparticles. Anal Bioanal Chem. 2010;397:2109–2116. doi: 10.1007/s00216-010-3775-8. - DOI - PubMed
    1. Ali MM, Janic B, Babajani-Feremi A, Varma NR, Iskander AS. et al.Changes in vascular permeability and expression of different angiogenic factors following anti-angiogenic treatment in rat glioma. PLoS One. 2010;5:e8727. doi: 10.1371/journal.pone.0008727. - DOI - PMC - PubMed
    1. Bhatt RS, Seth P, Sukhatme VP. Biomarkers for monitoring antiangiogenic therapy. Clin Cancer Res. 2007;13:777s–780s. doi: 10.1158/1078-0432.CCR-06-1922. - DOI - PubMed

Publication types

LinkOut - more resources