. 2012 Apr;241(4):814-29.
doi: 10.1002/dvdy.23762.

Overlapping expression patterns and redundant roles for AP-2 transcription factors in the developing mammalian retina

Affiliations

Overlapping expression patterns and redundant roles for AP-2 transcription factors in the developing mammalian retina

Erin A Bassett et al. Dev Dyn. 2012 Apr.

Abstract

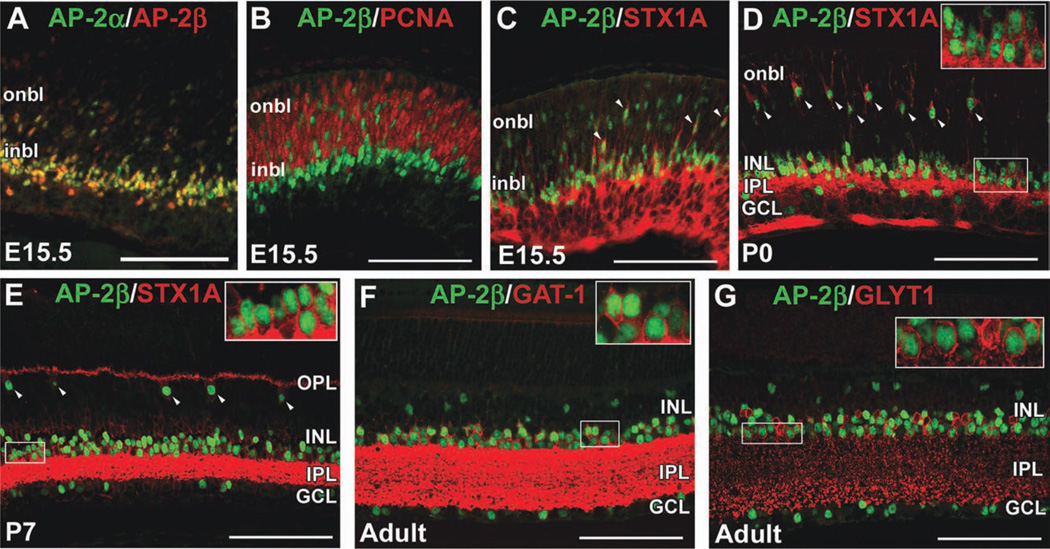
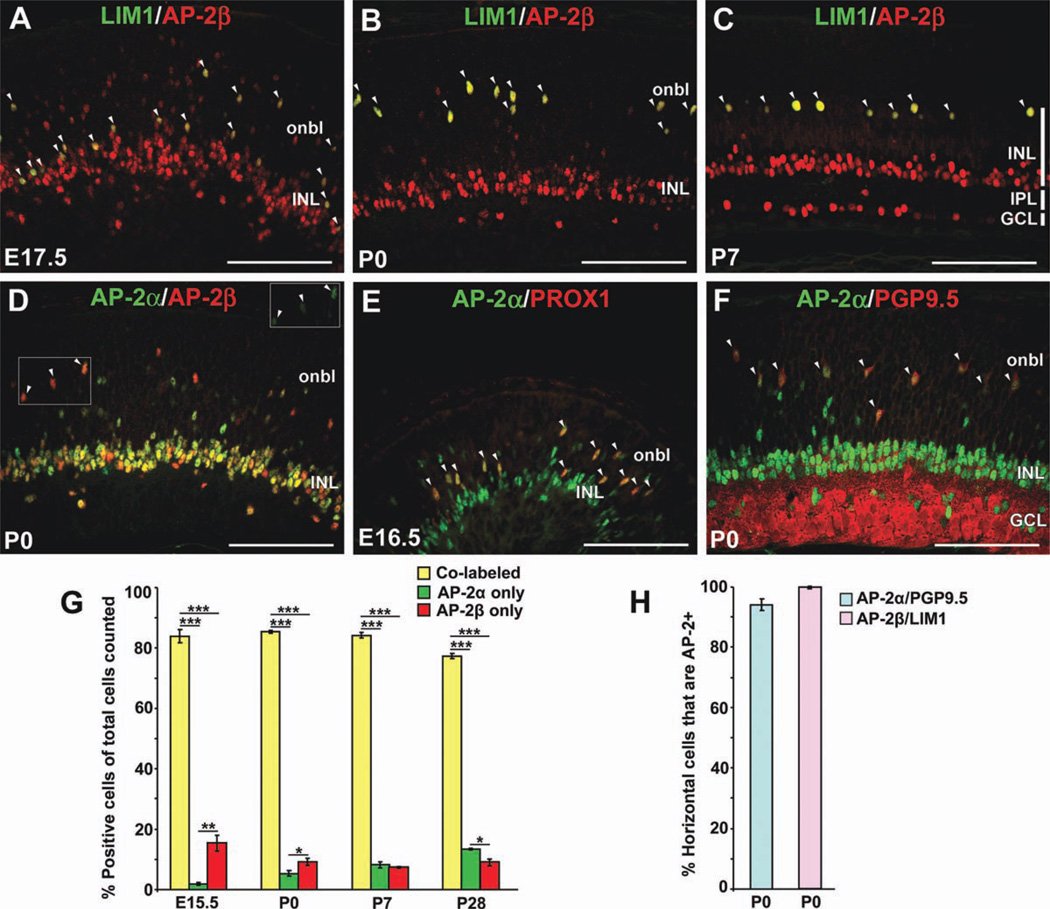
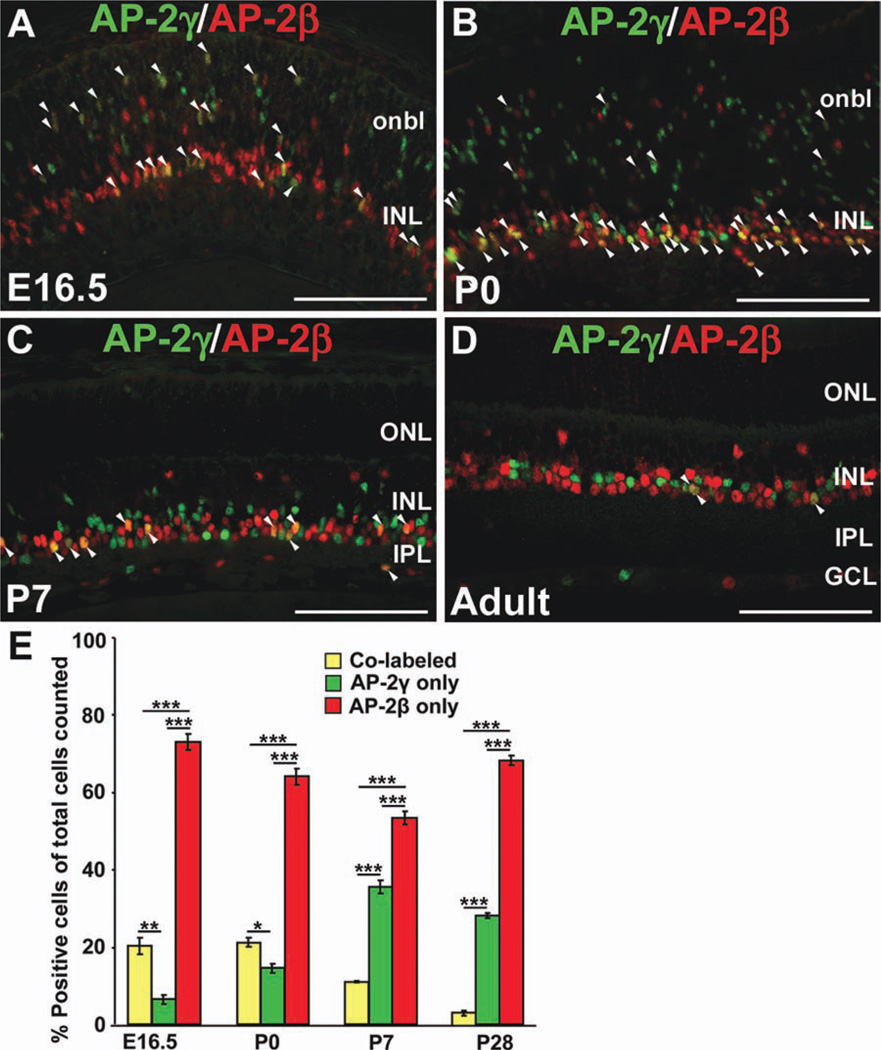
Background: We have previously shown that the transcription factor AP-2α (Tcfap2a) is expressed in postmitotic developing amacrine cells in the mouse retina. Although retina-specific deletion of Tcfap2a did not affect retinogenesis, two other family members, AP-2β and AP-2γ, showed expression patterns similar to AP-2α.

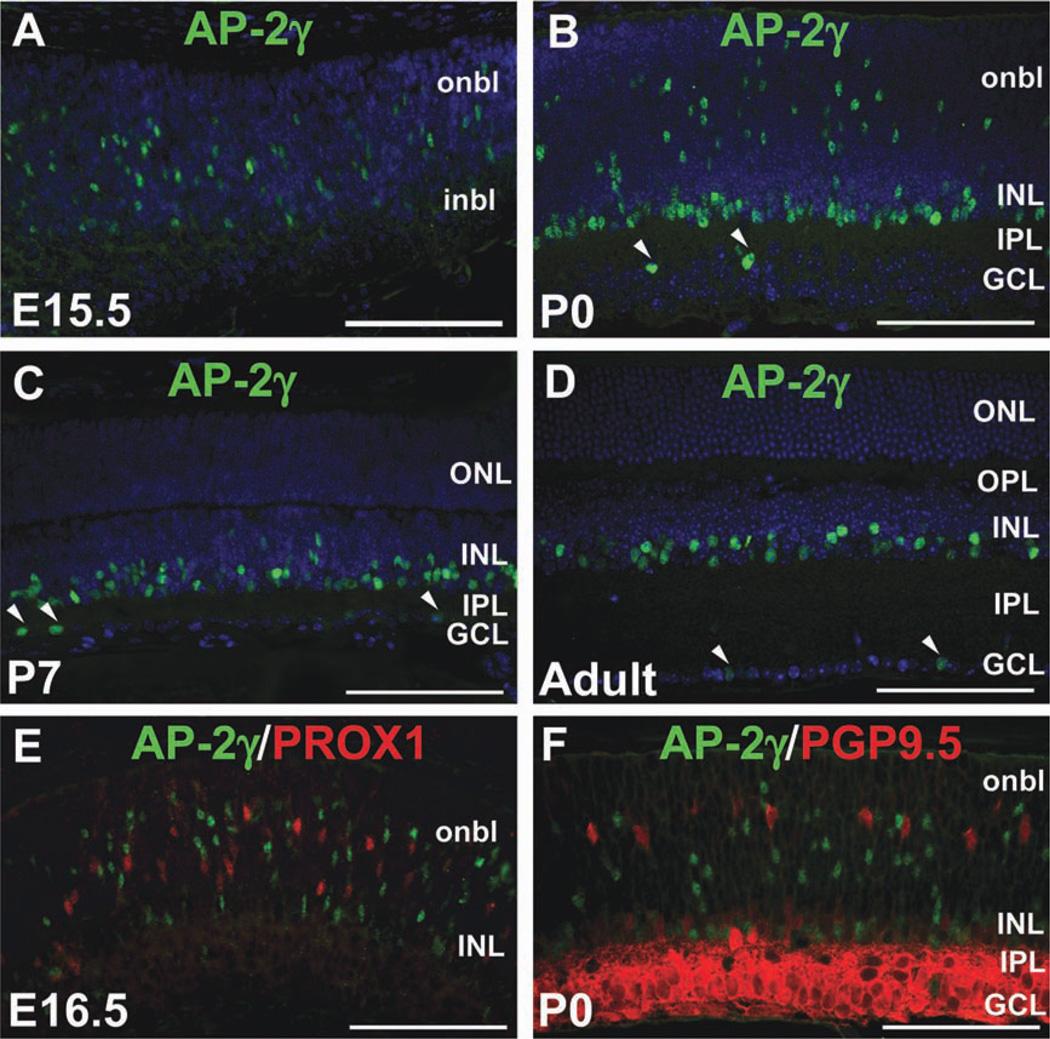
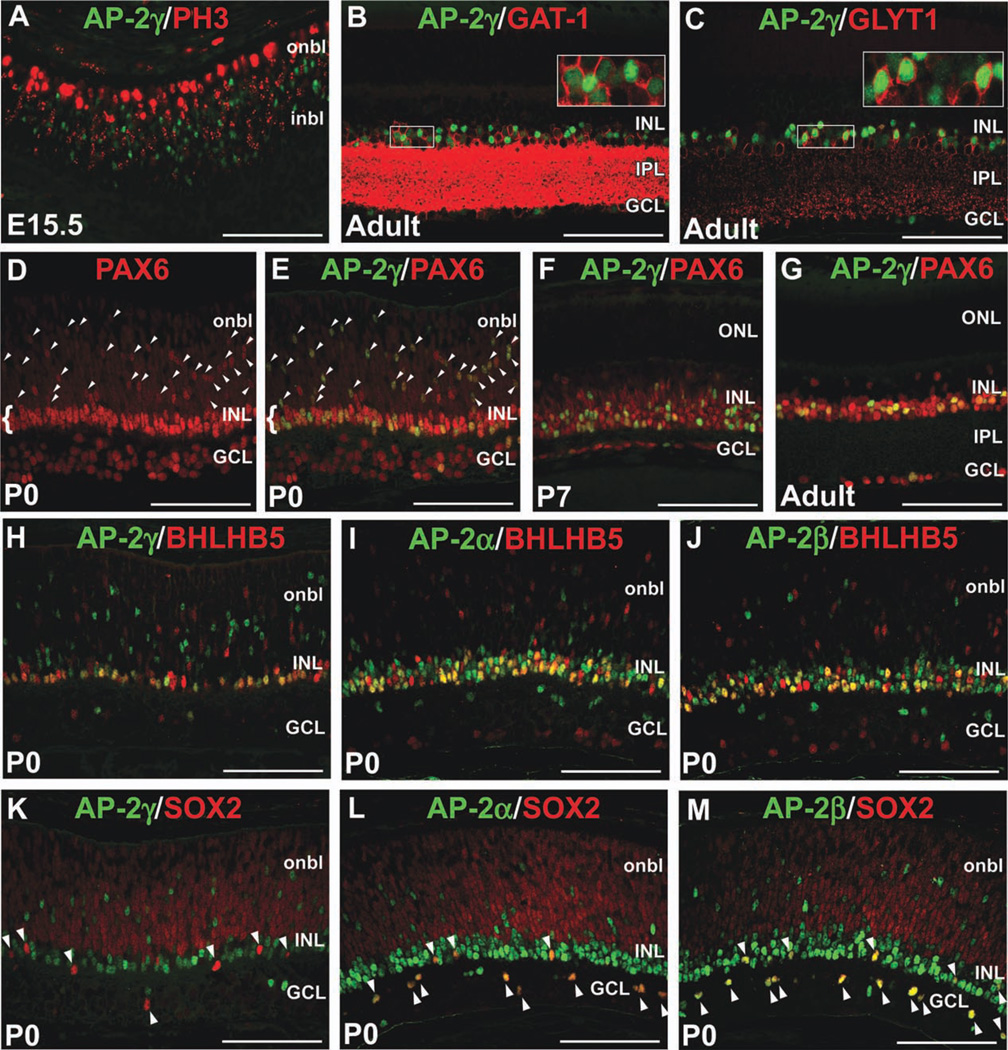
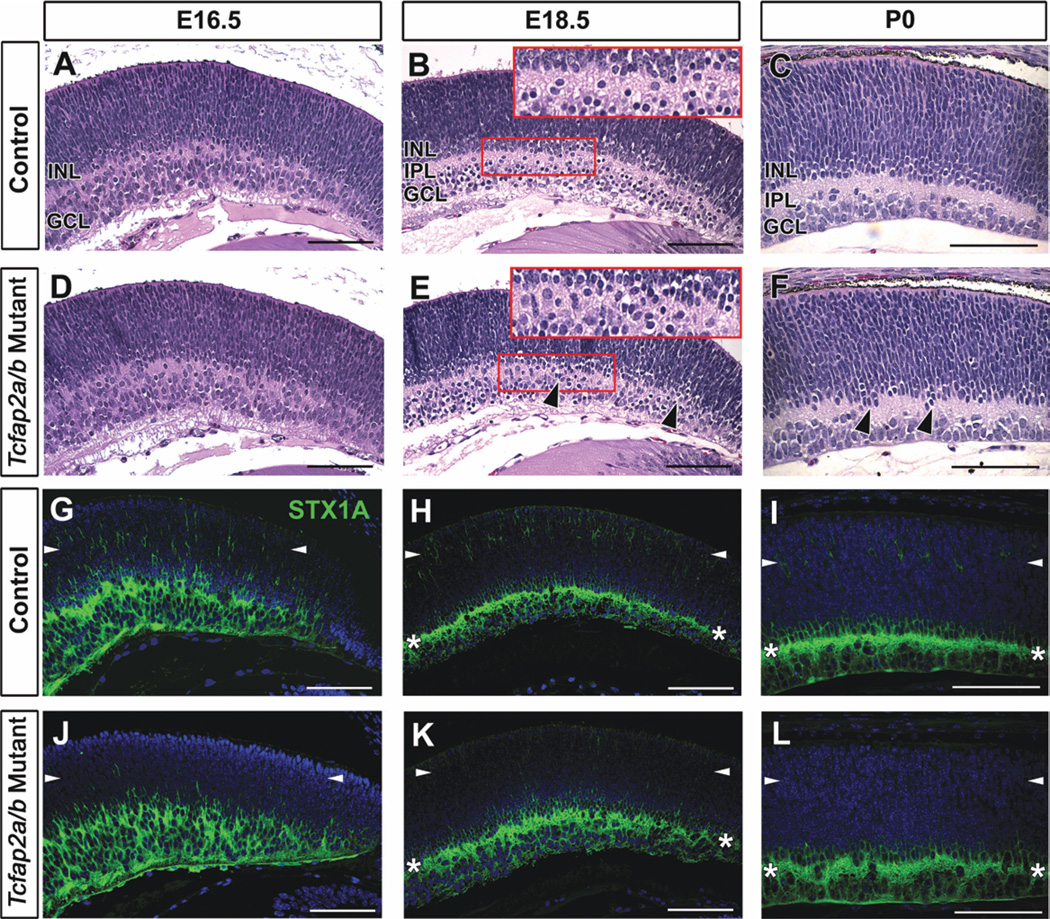
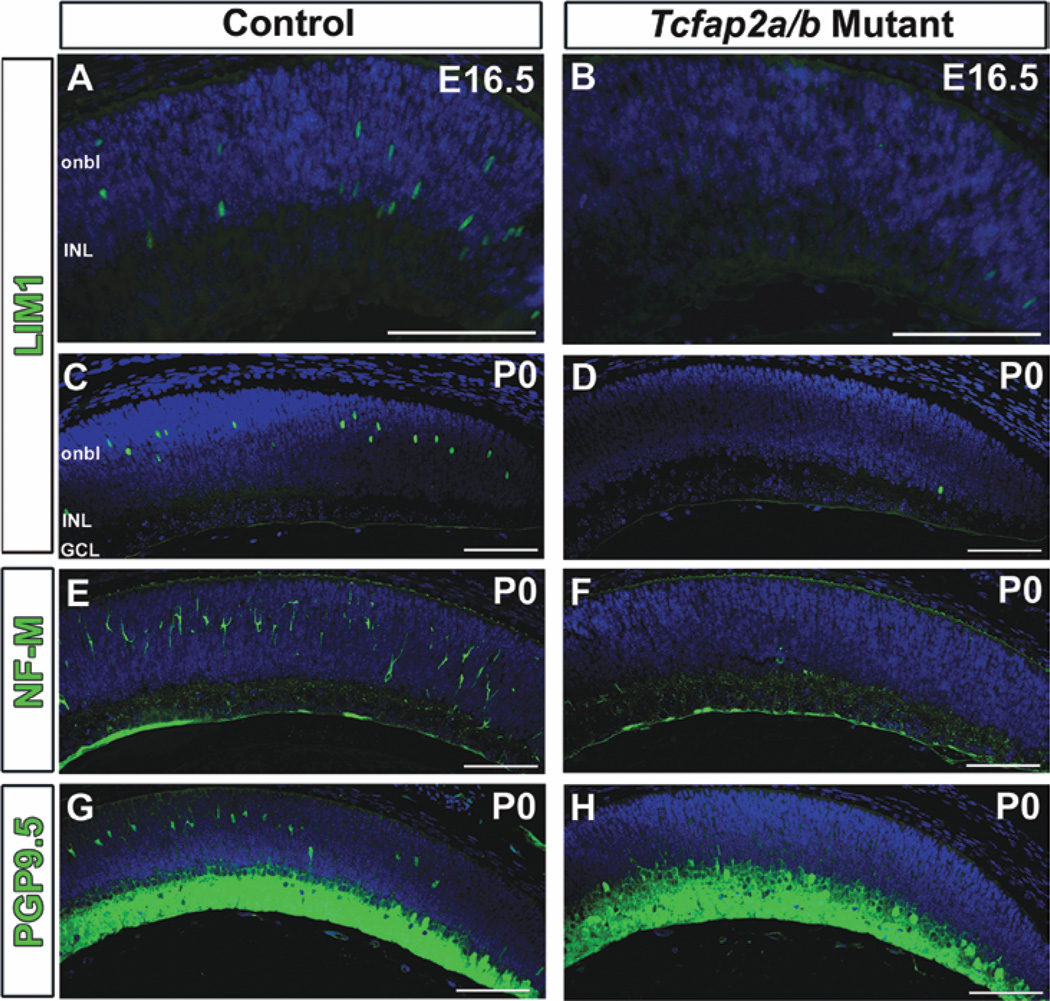
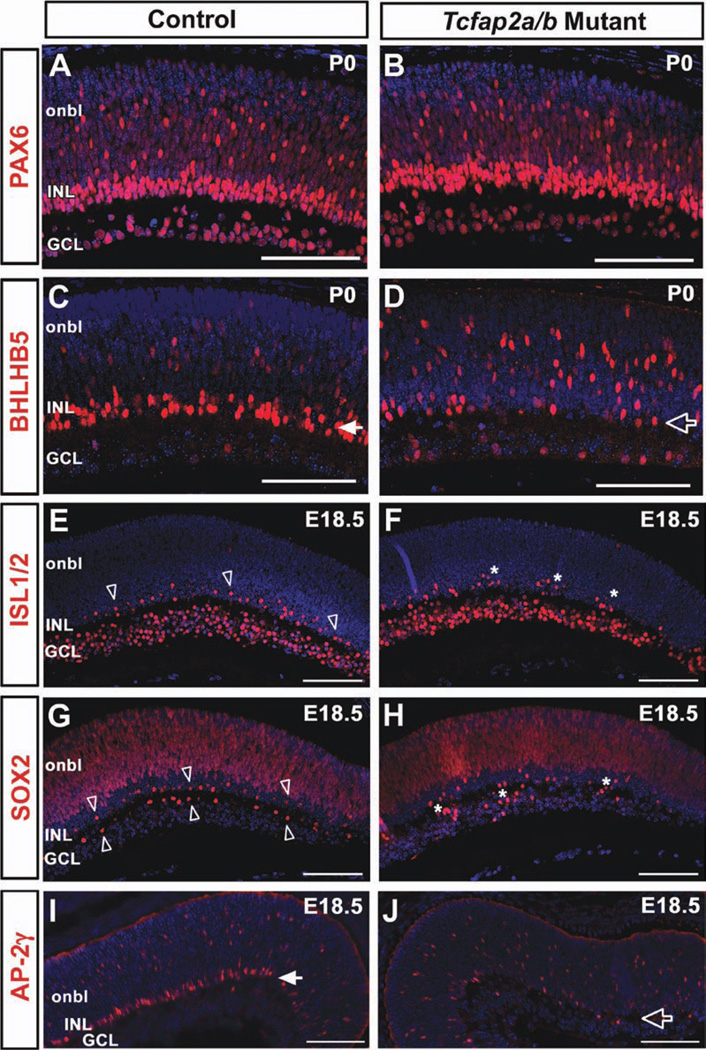
Results: Here we show that, in addition to their highly overlapping expression patterns in amacrine cells, AP-2α and AP-2β are also co-expressed in developing horizontal cells. AP-2γ expression is restricted to amacrine cells, in a subset that is partially distinct from the AP-2α/β-immunopositive population. To address possible redundant roles for AP-2α and AP-2β during retinogenesis, Tcfap2a/b-deficient retinas were examined. These double mutants showed a striking loss of horizontal cells and an altered staining pattern in amacrine cells that were not detected upon deletion of either family member alone.

Conclusions: These studies have uncovered critical roles for AP-2 activity in retinogenesis, delineating the overlapping expression patterns of Tcfap2a, Tcfap2b, and Tcfap2c in the neural retina, and revealing a redundant requirement for Tcfap2a and Tcfap2b in horizontal and amacrine cell development.


Figures

Fig. 1
Fig. 1. AP-2β is expressed in postmitotic amacrine and horizontal cells in the developing mouse retina
A: Co-immunostain with anti-AP-2α (green) and anti-AP-2β (red) on horizontal section of E15.5 wild-type eye. B–G: Co-immunostain with anti-AP-2β (green) and either anti-PCNA (B), anti-STX1A (C–E), anti-GAT-1 (F), or anti-GLYT1 (G) antibodies (red) on horizontal sections of wild-type eyes, at the stages indicated. Arrowheads in C–E point to cells co-labeled by anti-AP-2β and anti-STX1A. Boxed areas in E–G are magnified in inset. i/onbl, inner/outer neuroblast layer; INL, inner nuclear layer; GCL, ganglion cell layer; IPL, inner plexiform layer; OPL, outer plexiform layer. Scale bars = 100 µm.
Fig. 2
Fig. 2. Both AP-2α and AP-2β are expressed in developing mouse horizontal cells, although AP-2α expression is transient
A–F: Co-immunolabeling with anti-LIM1 (green) and anti-AP-2β (red; A–C); anti-AP-2α (green) and anti-AP-2β (red; D); anti-AP-2α (green) and anti-PROX1 (red; E); or anti-AP-2α (green) and anti-PGP9.5 (red; F) on horizontal sections of wild-type eyes, at the stages indicated. All LIM1-positive horizontal cells are AP-2β-positive (A–C, arrowheads). Arrowheads in D denote cells that are strongly AP-2β-immunoreactive and also more weakly AP-2α-immunoreactive (inset). Arrowheads in E and F point to PROX1-positive or PGP9.5-positive horizontal cells that co-express AP-2α. G: Quantification of the proportions of co-labeled versus singly labeled cells in the total AP-2 population examined (AP-2α and/or AP-2β-positive), at the stages indicated. Note that the relative proportions of co-labeled versus singly labeled cells were not significantly affected by the stage examined. H: Quantification of the proportion of PGP9.5-positive horizontal cells expressing AP-2α and proportion of LIM1-positive cells expressing AP-2β at P0. Bars represent the mean ±SEM of counts from 3 animals. onbl, outer neuroblast layer; INL, inner nuclear layer; GCL, ganglion cell layer; IPL, inner plexiform layer. ***P < 0.001; **P < 0.01; *P < 0.05. Scale bars = 100 µm.
Fig. 3
Fig. 3. AP-2γ is not a horizontal cell marker
A–D: Immunofluorescence using anti-AP-2γ clone 6E4 (green) on horizontal sections of wild-type mouse heads or eyes counterstained with DAPI (4,6-diamino-2-phenylindole (DAPI; blue), at the stages indicated. Arrowheads in B–D indicate AP-2γ-immunoreactive cells in the GCL. E,F: Co-immunostain with anti-AP-2γ (green) and either anti-PROX1 (E) or anti-PGP9.5 (F) antibodies (red) on horizontal sections of wild-type eyes, at the stages indicated. i/onbl, inner/outer neuroblast layer; INL, inner nuclear layer; GCL, ganglion cell layer; IPL, inner plexiform layer; OPL, outer plexiform layer. Scale bars = 100 µm.
Fig. 4
Fig. 4. AP-2γ is expressed in postmitotic amacrine cells
A–C: Co-immunostain with anti-AP-2γ (green) and either anti-PH3 (A), anti-GAT-1 (B), or anti-GLYT1 (C) antibodies (red) on horizontal sections of wild-type eyes, at the stages indicated. Boxed areas in B and C are magnified in inset. D–G: Co-immunostain with anti-AP-2γ (green) and anti-PAX6 (red) on horizontal sections of wild-type eyes at the stages indicated. D shows PAX6 alone while E shows double merge of the same image. Arrowheads in D and E denote strongly immunoreactive PAX6-positive cells in the neuroblast layer. Brackets in D and E indicate PAX6-positive amacrine cells in the INL. H–M: Co-immunostains of different AP-2 family members indicated (green) with BHLHB5 or SOX2 (red) at P0. Arrowheads in K–M point to SOX2-positive cholinergic amacrine cells, which co-express AP-2α and AP-2β (L,M) but not AP-2γ (K). i/onbl, inner/outer neuroblast layer; INL, inner nuclear layer; GCL, ganglion cell layer; IPL, inner plexiform layer; ONL, outer nuclear layer. Scale bars = 100 µm.
Fig. 5
Fig. 5. The AP-2γ-immunopositive amacrine cell population only partially overlaps with the AP-2β-immunopositive amacrine cell population
A–D: Co-immunolabeling with anti-AP-2γ (green) and anti-AP-2β (red) on horizontal sections of wild-type eyes, at the stages indicated. Arrowheads denote double-labeled cells. E: Quantification of the proportions of co-labeled versus singly labeled cells in the total AP-2 population examined (AP-2γ and/or AP-2β-positive), at the stages indicated. Bars represent the mean ±SEM of counts from 3 animals. ***P < 0.001; **P < 0.01; *P < 0.05. onbl, outer neuroblast layer; INL, inner nuclear layer; GCL, ganglion cell layer; IPL, inner plexiform layer; ONL, outer nuclear layer. Scale bars = 100 µm.
Fig. 6
Fig. 6
Subtle disorganization and diminished syntaxin immunoreactivity in the retina in Tcfap2a/b mutants. A–F: Horizontal H&E-stained sections of control (A–C) and Tcfap2a/b mutant (D–F) peripheral retinas, at the stages indicated. Black arrowheads (E,F) show regions of mutant retinas that appear less organized than controls. Red boxes in B and E are magnified in insets. G–L: Horizontal sections of control (G–I) and Tcfap2a/b mutant (J–L) peripheral retinas immunolabeled with anti-STX1A (green). Asterisks (H,I,K,L) indicate the band of STX1A-labeled amacrine cell processes in the IPL. The STX1A immunoreactivity detected in the outer retina of control mice (G–I, arrowheads) was diminished in Tcfap2a/b mutants (J–L, arrowheads). INL, inner nuclear layer; GCL, ganglion cell layer; IPL, inner plexiform layer. Scale bars = 100 µm.
Fig. 7
Fig. 7
Deletion of Tcfap2a and Tcfap2b leads to loss of retinal horizontal cells. A–H: Horizontal sections of control (A,C,E,G) and Tcfap2a/b mutant (B,D,F,H) peripheral retinas immunolabeled (green) with anti-LIM1 (A–D), anti-neurofilament medium chain (NF-M; E,F) or anti-PGP9.5 (G,H) antibodies and counterstained with DAPI (4,6-diamino-2-phenylindole; blue) at E16.5 (A,B) or P0 (C–H). onbl, outer neuroblast layer; INL, inner nuclear layer; GCL, ganglion cell layer. Scale bars = 100 µm.
Fig. 8
Fig. 8
Altered immunostaining patterns of amacrine cell markers in Tcfap2a/b mutant retinas. A–J: Horizontal sections of control (A,C,E,G,I) and Tcfap2a/b mutant (B,D,F,H,J) peripheral retinas immunolabeled (red) with anti-PAX6 (A,B), anti-BHLHB5 (C,D), anti-ISL1/2 (E,F), anti-SOX2 (G,H) or anti-AP-2γ (I,J) and counterstained with DAPI (4,6-diamino-2-phenylindole; blue), at the stages indicated. Closed arrows in C and I denote the band of BHLHB5-positive or AP-2γ-positive cells, respectively, clearly forming in the control INL, which was not observed in mutants (open arrows in D,J). Open arrowheads in E and G point to the developing cholinergic amacrine mosaic in control retinas, whereas asterisks in F and H indicate cholinergic cells that are failing to exhibit regular spacing in mutant retinas. onbl, outer neuroblast layer; INL, inner nuclear layer; GCL, ganglion cell layer. Scale bars = 100 µm.

References

    1. Ajioka I, Martins RA, Bayazitov IT, Donovan S, Johnson DA, Frase S, Cicero SA, Boyd K, Zakharenko SS, Dyer MA. Differentiated horizontal interneurons clonally expand to form metastatic retinoblastoma in mice. Cell. 2007;131:378–390. - PMC - PubMed
    1. Alexiades MR, Cepko CL. Subsets of retinal progenitors display temporally regulated and distinct biases in the fates of their progeny. Development. 1997;124:1119–1131. - PubMed
    1. Auman HJ, Nottoli T, Lakiza O, Winger Q, Donaldson S, Williams T. Transcription factor AP-2gamma is essential in the extra-embryonic lineages for early postimplantation development. Development. 2002;129:2733–2747. - PubMed
    1. Bassett EA, Pontoriero GF, Feng W, Marquardt T, Fini ME, Williams T, West-Mays JA. Conditional deletion of activating protein 2alpha (AP-2alpha) in the developing retina demonstrates non-cell-autonomous roles for AP-2alpha in optic cup development. Mol Cell Biol. 2007;27:7497–7510. - PMC - PubMed
    1. Bassett EA, Williams T, Zacharias AL, Gage PJ, Fuhrmann S, West-Mays JA. AP-2alpha knockout mice exhibit optic cup patterning defects and failure of optic stalk morphogenesis. Hum Mol Genet. 2010;19:1791–1804. - PMC - PubMed

Publication types

LinkOut - more resources