. 2012 May 3;119(18):4253-63.
doi: 10.1182/blood-2011-10-385658. Epub 2012 Mar 12.

Rac2-MRC-cIII-generated ROS cause genomic instability in chronic myeloid leukemia stem cells and primitive progenitors

Affiliations

Rac2-MRC-cIII-generated ROS cause genomic instability in chronic myeloid leukemia stem cells and primitive progenitors

Margaret Nieborowska-Skorska et al. Blood. .

Abstract

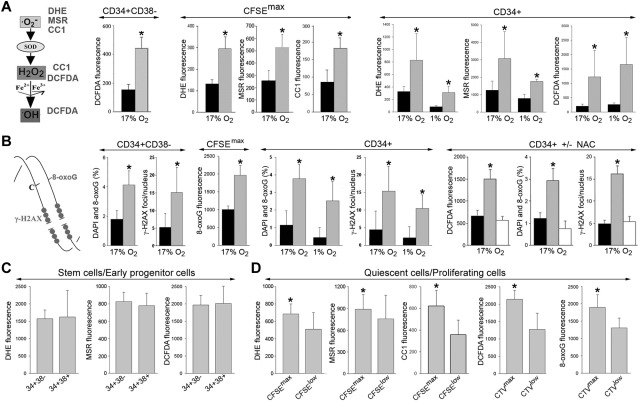
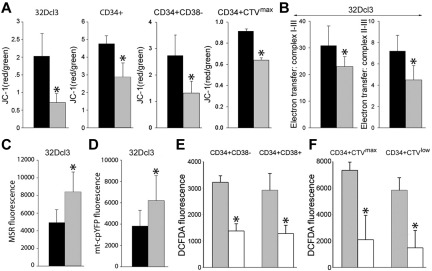
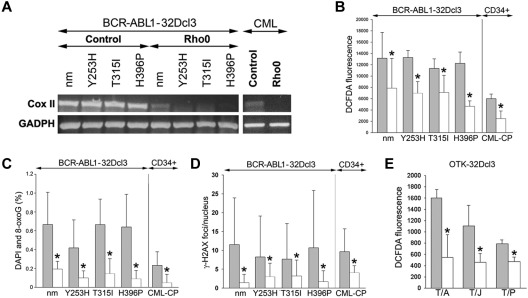
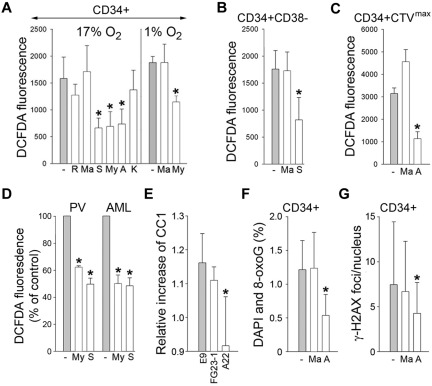
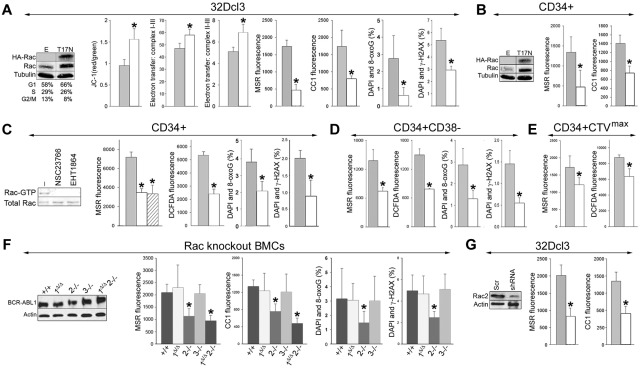
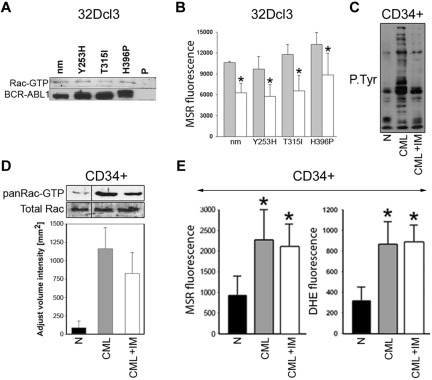
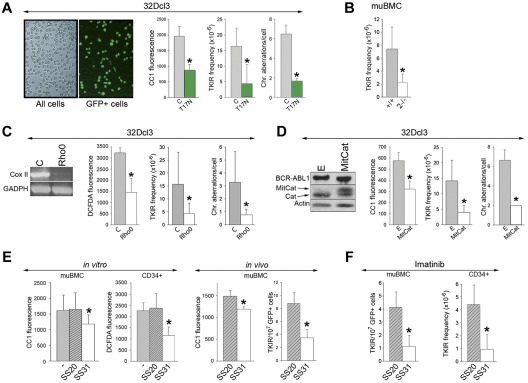
Chronic myeloid leukemia in chronic phase (CML-CP) is induced by BCR-ABL1 oncogenic tyrosine kinase. Tyrosine kinase inhibitors eliminate the bulk of CML-CP cells, but fail to eradicate leukemia stem cells (LSCs) and leukemia progenitor cells (LPCs) displaying innate and acquired resistance, respectively. These cells may accumulate genomic instability, leading to disease relapse and/or malignant progression to a fatal blast phase. In the present study, we show that Rac2 GTPase alters mitochondrial membrane potential and electron flow through the mitochondrial respiratory chain complex III (MRC-cIII), thereby generating high levels of reactive oxygen species (ROS) in CML-CP LSCs and primitive LPCs. MRC-cIII-generated ROS promote oxidative DNA damage to trigger genomic instability, resulting in an accumulation of chromosomal aberrations and tyrosine kinase inhibitor-resistant BCR-ABL1 mutants. JAK2(V617F) and FLT3(ITD)-positive polycythemia vera cells and acute myeloid leukemia cells also produce ROS via MRC-cIII. In the present study, inhibition of Rac2 by genetic deletion or a small-molecule inhibitor and down-regulation of mitochondrial ROS by disruption of MRC-cIII, expression of mitochondria-targeted catalase, or addition of ROS-scavenging mitochondria-targeted peptide aptamer reduced genomic instability. We postulate that the Rac2-MRC-cIII pathway triggers ROS-mediated genomic instability in LSCs and primitive LPCs, which could be targeted to prevent the relapse and malignant progression of CML.


Figures

Figure 1
Figure 1
Elevated levels of ROS and oxidative DNA damage in primitive CML-CP CD34+ subsets. (A) DHE, MSR, CC1, and DCFDA were used to detect various ROS with different DNA damaging capabilities (left). ROS was measured in CD34+CD38, quiescent CD34+CFSEmax (CFSEmax), and total CD34+ cells from healthy donors (black bars) and CML-CP patients (gray bars) in 17% and 1% O2, as indicated. (B) Diagram showing oxidative DNA lesions: 8-oxoG and DSBs (stained by γ-H2AX; left). 8-oxoG and γ-H2AX were detected by specific fluorescence in CD34+CD38, quiescent CD34+CFSEmax (CFSEmax), and total CD34+ cells from healthy donors (black bars) and CML-CP patients (gray bars) maintained in 17% and 1% O2, as indicated (CD34+ ± NAC). CD34+ cells from healthy donors (black bars) and those from CML-CP patients were incubated (white bars) or not (gray bars) with 50μM N-acetyl-L-cysteine for 48 hours. ROS (DCFDA fluorescence), 8-oxoG, and γ-H2AX foci were detected. (C-D) ROS (DHE, MSR, CC1, and DCFDA fluorescence) and/or 8-oxoG was detected in CD34+CD38 and CD34+CD38+ CML-CP cells (C) and in CD34+(CFSEmax or CTVmax) quiescent and CD34+(CFSElow or CTVlow) proliferating CML-CP cells (D). Results represent means of 3-20 samples/group ± SD. *P < .05 compared with healthy counterparts (A-B), these treated with NAC (B), and CFSElow or CTVlow (D).
Figure 2
Figure 2
Biochemical alterations in the mitochondria in BCR-ABL1 leukemia cells. (A) BCR-ABL1-32Dcl3 cells (gray bars) and 32Dcl3 cells (black bars), and CD34+, CD34+CD38 and CD34+CTVmax cells from CML-CP patients (gray bars) and healthy donors (black bars) were stained with JC-1 and the red/green fluorescence ratio is shown. (B) 32Dcl3 cells (black bars) and BCR-ABL1-32Dcl3 cells (gray bars) were used to measure electron transfer activity between MRC complexes I-III (left panel) and II-III (right panel). (C-D) Mitochondrial ·O2 was measured in 32Dcl3 cells (black bars) and BCR-ABL1-32Dcl3 cells (gray bars) by MSR (C) and mt-cpYFP fluorescence (D). (E-F) ROS were measured by DCFDA in CML-CP CD34+CD38 and CD34+CD38+ subpopulations (E) and in CD34+CTVmax quiescent and CD34+CTVlow proliferative cells incubated (white bars) or not (gray bars) with mitochondria-targeted ubiquinone (F). Results represent mean values of a minimum of 3 measurements/group ± SD. *P < .05 compared with normal/parental (A-D) and untreated (E-F) cells.
Figure 3
Figure 3
MRC-depleted BCR-ABL1 leukemia cells display reduced ROS and oxidative DNA damage. (A-D) BCR-ABL1-32Dcl3 cells expressing nonmutated BCR-ABL1 kinase (nm) and indicated TKI-resistant (TKIR) mutants and CD34+ cells from CML-CP patients (control cells, gray bars) were depleted of mtDNA (Rho0 cells, white bars). (A) Expression of Cox II and GADPH mRNA by RT-PCR. ROS were detected by DCFDA (B) and 8-oxoG (C) and γ-H2AX (D) foci were analyzed by immunofluorescence. (E) ROS were detected by DCFDA in 32Dcl3 cells expressing TEL-ABL1 (T/A), TEL-JAK2 (T/J), and TEL-PDGFβR (T/P; gray bars) and in corresponding Rho0 cells (white bars). Results represent mean values ± SD from a minimum of 2 experiments/group (A,B,E) and from 25-55 cells/group (C-D). *P < .05 compared with control cells.
Figure 4
Figure 4
MRC-cIII is responsible for ROS-induced oxidative DNA damage in primitive CML-CP CD34+ subsets and in PV and AML cells. CD34+ (A), CD34+CD38 (B), and quiescent CD34+CTVmax (C) cells from CML-CP patients were incubated without (gray bars) or with (white bars) the indicated inhibitors (R indicates rotenone; Ma, malonate; S, stigmatellin; My, myxothiazol; A, antimycin; and K, KCN) for 3 hours in 17% or 1% O2 (A) and in 17% O2 (B-C). ROS were measured by DCFDA. (D) ROS were also measured by DCFDA in primary FLT3(ITD)–positive AML cells and in JAK2(V617F)–positive PV cells untreated (−) or treated with myxothiazol (My) or stigmatellin (S). Results show relative ROS levels compared with untreated cells. (E) Control L929 cells (E9) and clones containing a defective mutation in complex I (FG23-1) and complex III (A22) were cotransfected with BCR-ABL1–IRES-GFP or IRES-GFP expression plasmid. ROS was measured 72 hours later in GFP+ cells with CC1. Results represent the relative increase of ROS in BCR-ABL1+ cells. 8-oxoG (F) and γ-H2AX (G) DNA lesions were detected in CD34+ CML-CP cells incubated with malonate, antimycin A, or diluent (−) for 48 hours. Results represent mean values of a minimum of 3 measurements/group ± SD. *P < .05 compared with the untreated cells (A-D,F-G) and with E9 (E).
Figure 5
Figure 5
Rac2 induces mitochondrial ROS, oxidative DNA damage, and genomic instability. (A) BCR-ABL1-32Dcl3 cells were transfected with pMIG-HA-Rac(T17N)–IRES-GFP or LXSP-Rac(T17N) (T17N) and pMIG-IRES-GFP or LXSP (E) retroviruses. Expression of HA-tagged Rac(T17N) mutant and total Rac was detected by Western blot analysis. Results from cells expressing E and T17N are represented by gray and white bars, respectively. ΔΨm (JC-1 red/green fluorescence ratio), electron transport between MRC complexes I-III and II-III, ROS (MSR and CC1 fluorescence), 8-oxoG, and DSBs (marked by γ-H2AX) were assessed (respective panels). (B) CD34+ CML-CP cells were transfected with HA-Rac(T17N)–IRES-GFP (T17N) or IRES-GFP (E) retroviruses. Western blot analyses of the expression of HA-tagged Rac(T17N) mutant and total Rac in GFP+ cells. ROS (bar panels) were measured with MSR and CC1. CD34+ (C), CD34+CD38 (D), and quiescent CD34+CTVmax (E) CML-CP cells were untreated (−) or treated with NSC23766 or EHT1864. (C) Western blot. Rac activation assay: reaction samples (topbox) and total cell lysates (bottom box) were analyzed for Rac-GTP and total Rac protein content, respectively. (C-E bar panels) ROS (MRC and DCFDA fluorescence), 8-oxoG, and γ-H2AX were measured in untreated cells (gray bars) and in cells treated with NSC23766 (white bars) and EHT1864 (striped bars). (F) BCR-ABL1 detected by Western analysis in double-positive, Rac1Δ/Δ, Rac2−/−, Rac3−/−, and Rac1Δ/ΔRac2−/− muBMCs. ROS (MSR and CC1 fluorescence) and oxidative DNA lesions (8-oxoG) and DSBs (γ-H2AX) were detected (bar panels). (G) BCR-ABL1-32Dcl3 cells were transfected with pGFP-V-RS retroviral vector encoding Rac2-specific shRNA (shRNA) or scrambled RNA (Scr). Down-regulation of Rac2 in GFP+ cells was detected by Western blot analysis. ROS (MRC and CC1 fluorescence) were measured in GFP+ cells expressing Scr (gray bars) and shRNA (white bars). Results represent mean values of a minimum of 3 measurements/group ± SD (A-E,G) and mean values of 3-14 muBMC samples/group ± SD (F). *P < .05 compared with empty/Scr plasmid (A,B,G), untreated cells (C-E), and double-positive cells (F).
Figure 6
Figure 6
Role of Rac in the induction of mitochondrial ROS in TKI-resistant BCR-ABL1 cells and CD34+ CML-CP cells treated with imatinib. (A) Rac activation was examined in 32Dcl3 parental cells (P) and clones expressing nonmutated BCR-ABL1 (nm) and the indicated TKI-resistant mutants (Y253H, T315I, and H396P) using a PAK-binding domain pull-down assay; top box shows the Rac-GTP protein content, bottom box shows the expression of BCR-ABL1 protein variants. (B) The indicated cells were transfected with HA-Rac(T17N)-IRES-GFP (white bars) or IRES-GFP (gray bars) retroviral particles and mitochondrial ·O2 was measured with MSR in GFP+ cells. (C-E) CD34+ cells from healthy donors (N) and from CML-CP patients were incubated with 1μM imatinib (CML + IM) or placebo (CML) for 12 hours in the presence of growth factors. (C) Tyrosine phosphorylation (P.Tyr) of total cellular proteins was analyzed by Western blot using anti-phosphotyrosine Ab. (D) Top panel is a representative Western blot analysis of the Rac-GTP active form detected using a PAK-binding domain pull-down assay; bottom panel shows the total Rac protein in cell lysates by densitometric analysis of Rac-GTP. (E) Total cellular and mitochondrial ·O2 was measured with the use of DHE and MSR, respectively. Results represent mean values of 2 or 3 measurements/group ± SD. *P < .05 compared with cells transfected with an empty plasmid (B) or normal counterparts (D).
Figure 7
Figure 7
Targeting the Rac-mitochondrial ROS pathway reduces genomic instability in BCR-ABL1 leukemia cells. (A) GFP+ BCR-ABL1-32Dcl3 cells expressing Rac(T17N) and GFP- BCR-ABL1-32Dcl3 control cells (C) as illustrated. BCR-ABL1+/+ and Rac2−/− muBMCs are described in Figure 5F (B); BCR-ABL1-32Dcl3 Rho0 cells (Rho0) and BCR-ABL1-32Dcl3 MRC-proficient cells (C) as confirmed by RT-PCR–detected down-regulation of expression of Cox II in Rho0 cells; and BCR-ABL1-32Dcl3 cells expressing MitCat (D), or empty plasmid (E) as documented by Western analysis showing the expression of BCR-ABL1, MitCat, and endogenous catalase (Cat), were maintained for 8 (B) or 12 (A,C,D) weeks in liquid culture. ROS were measured using CC1 and DCFDA fluorescence. The frequency of TKI-resistant (TKIR) clones and/or spectral karyotyping analysis of chromosomal aberrations were determined; results represent mean values of a minimum of 3 experiments ± SD. (E) In the in vitro experiment, BCR-ABL1 muBMCs and CML-CP CD34+ cells were cultured either without (−) or with SS20 or SS31 peptides. ROS were measured using CC1 and DCFDA fluorescence; results represent mean values of a minimum of 3 experiments ± SD. In the in vivo experiment, 5 SCID mice/group bearing GFP+ BCR-ABL1 muBMCs were treated with SS20 or SS31 for 6-8 weeks. ROS (CC1 fluorescence) and the number of TKIR clones in GFP+ muBMCs were determined. (F) Left panel shows 5 SCID mice/group bearing GFP+ BCR-ABL1 muBMCs treated with imatinib and SS20 or SS31 for 8 weeks. TKIR clones were detected in GFP+ cells from BM and spleen. Right panel shows CD34+ cells from 2 CML-CP patients cultured for 6 weeks with imatinib and SS20 or SS31 in medium supplemented with growth factors, after which time the frequency of TKIR clones was determined. *P < .05 compared with control, untreated, and SS20-treated cells or animals.

References

    1. Hanahan D, Weinberg RA. Hallmarks of cancer: the next generation. Cell. 2011;144(5):646–674. - PubMed
    1. Melo JV, Barnes DJ. Chronic myeloid leukaemia as a model of disease evolution in human cancer. Nat Rev Cancer. 2007;7(6):441–453. - PubMed
    1. Corbin AS, Agarwal A, Loriaux M, Cortes J, Deininger MW, Druker BJ. Human chronic myeloid leukemia stem cells are insensitive to imatinib despite inhibition of BCR-ABL activity. J Clin Invest. 2011;121(1):396–409. - PMC - PubMed
    1. Perrotti D, Jamieson C, Goldman J, Skorski T. Chronic myeloid leukemia: mechanisms of blastic transformation. J Clin Invest. 2010;120(7):2254–2264. - PMC - PubMed
    1. Slupphaug G, Kavli B, Krokan HE. The interacting pathways for prevention and repair of oxidative DNA damage. Mutat Res. 2003;531(1-2):231–251. - PubMed

Publication types

MeSH terms