. 2012 Mar 19;196(6):775-88.
doi: 10.1083/jcb.201201038. Epub 2012 Mar 12.

BDNF and its pro-peptide are stored in presynaptic dense core vesicles in brain neurons

Affiliations

BDNF and its pro-peptide are stored in presynaptic dense core vesicles in brain neurons

Sandra Dieni et al. J Cell Biol. .

Abstract

Although brain-derived neurotrophic factor (BDNF) regulates numerous and complex biological processes including memory retention, its extremely low levels in the mature central nervous system have greatly complicated attempts to reliably localize it. Using rigorous specificity controls, we found that antibodies reacting either with BDNF or its pro-peptide both stained large dense core vesicles in excitatory presynaptic terminals of the adult mouse hippocampus. Both moieties were ~10-fold more abundant than pro-BDNF. The lack of postsynaptic localization was confirmed in Bassoon mutants, a seizure-prone mouse line exhibiting markedly elevated levels of BDNF. These findings challenge previous conclusions based on work with cultured neurons, which suggested activity-dependent dendritic synthesis and release of BDNF. They instead provide an ultrastructural basis for an anterograde mode of action of BDNF, contrasting with the long-established retrograde model derived from experiments with nerve growth factor in the peripheral nervous system.


Figures
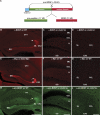
Figure 1.
Figure 1.
α-BDNF, α-Myc, and α–pro-BDNF antibodies all generate similar staining patterns. (A) A schematic representation of the BDNF precursor pro-BDNF and the two cleavage products pro-peptide and BDNF. (B) Low-power view of a WT hippocampal section stained with anti-BDNF antibodies. Note the intense staining in the hilus of the DG and in SL of CA3, each of which contains the axon terminals of mossy fibers. (C and D) Higher magnification view of the DG (C) and CA3 region (D) of the cbdnf ko hippocampus stained with anti-BDNF. Note the absence of immunoreactive signals in all cellular and neuropil layers. GCL, granule cell layer; H, hilus; IML, inner molecular layer; PCL, pyramidal cell layer. (E) Bdnf-Myc hippocampi stained with Myc antibodies show a similar staining pattern to that produced by BDNF antibodies. (F and G) Note the absence of staining in the corresponding DG (F) and CA3 regions (G) of WT sections treated with Myc antibodies. (H) Polyclonal pro-BDNF antibodies yield a similar pattern to that of anti-BDNF. (I and J) The same antibodies do not produce an immunoreactive signal in hippocampal sections from cbdnf ko animals. (B, E, and H) Arrows denote the end bulb of the mossy fiber projection, which delineates CA3 and CA1. Note the relative lack of staining in CA1 in WT and Bdnf-Myc sections. Bars: (B, E, and H) 500 µm; (C, F, and I) 100 µm; (D, G, and J) 50 µm.
Figure 2.
Figure 2.
Detection of BDNF-IR and pro-BDNF–IR in subsets of principal neurons. (A–C) Low-power confocal stack of the DG. The same subset of granule cells (arrows) coexpresses BDNF-IR (A) and pro-BDNF–IR (B). Boxed areas are enlarged in the inset images showing single BDNF-positive (A) and pro-BDNF–positive (B) granule cells counterstained with DAPI (blue), with labeling concentrated at the cell apex in distinct clusters (arrows) and partial overlap of BDNF and pro-BDNF signals (C, inset). GCL, granule cell layer; H, hilus; IML, inner molecular layer. (C) The merged image reveals an overlap of both signals. (D–F) Confocal stack of area CA3, demonstrating BDNF-IR (D) and pro-BDNF–IR (E) in a subset of pyramidal cell somata (arrows). Nuclei are labeled with DAPI. The prominent band of IR in SL corresponds to the terminal portions of the mossy fiber projection. PCL, pyramidal cell layer. (F) Note the uniform overlap of red and green signals in the overlay image. (G–J) High-resolution confocal stack of a single CA3 neuron labeled with antibodies against Myc (G), pro-BDNF (H), and GM130 (I). Note that the Myc-IR (G) and pro-BDNF–IR (H) extending into the apical dendrite (arrowheads) closely correspond to the Golgi complex (J, merged image). Arrows mark initial dendritic segments originating from the cell body. (K) Electron micrograph showing the Golgi complex (delineated by arrows) of a CA3 neuron labeled by anti–pro-BDNF immunogold. Clusters of gold grains aggregate around the cisterns of the Golgi apparatus. Bars: (A–F) 100 µm; (G–J) 10 µm; (K) 500 nm; (A–C, insets) 5 µm.
Figure 3.
Figure 3.
Presynaptic localization of BDNF-IR. (A–C) High-resolution optical slice of SL showing Myc-IR (A) and pro-BDNF–IR (B) in the same subset of MFBs (arrows). (C) Note the significant colocalization of red and green puncta in the overlay. (D and F) Merged images of SL labeled with antibodies to Myc and SYP (D) or Myc and VGLUT-1 (F). (E and G) Although BDNF-positive puncta are closely associated with SYP- and VGLUT-1–positive puncta, closer inspection at high magnification reveals segregation of the two markers (arrows), confirming that BDNF is presynaptically expressed but not in synaptic vesicles. (H–M) Costaining with antibodies against Myc and Met-enk. In the small subset of granule cells that coexpresses Myc-IR (H) and Met-enk–IR (I), puncta are similarly distributed throughout the cell but show little overlap (J). Asterisks mark the positions of the nucleus. Similarly, a small proportion of MFBs (arrows) in SL coexpresses Myc-IR (K) and Met-enk–IR (L); however, in the merged image (M), Myc- and Met-enk–IR puncta do not overlap. (N–P) High-resolution optical slice of SL demonstrating expression of Myc-IR (N) and CCK-IR (O) in mossy fiber terminals. Single asterisks label the CCK-IR profile, and double asterisks label the Myc-IR profile. (P) The merged image indicates complete segregation of the two peptides in the mossy fiber projection. (Q) High-resolution confocal image of SR in the CA1 region of a BDNF-Myc mouse. Labeling with anti-Myc antibodies reveals localization of BDNF in fine axonal processes (thin arrows in Q–S). (R) Colabeling with antibodies against synpo reveal the relative location of dendritic spines. (S) An overlay of anti-Myc and anti-synpo–labeled section shows presynaptic localization of BDNF, with close apposition between BDNF-IR and synpo-positive spines (white circles and filled arrows in Q–S). Bars: (A–C, E, G, and K–S) 5 µm; (D) 30 µm; (F) 50 µm; (H–J) 10 µm.
Figure 4.
Figure 4.
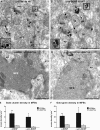
Ultrastructural localization of BDNF and pro-BDNF immunogold labeling in MFBs. (A) Electron micrograph of an ultrathin section of WT SL prelabeled with anti-BDNF immunogold. Numerous gold clusters (arrows) are associated with large secretory vesicles within the bouton (see inset). sp, dendritic spine. (B–D) An anti–pro-BDNF–labeled WT MFB containing cluster-labeled secretory vesicles (arrows). The inset image exemplifies a labeled large DCV. Large secretory vesicles labeled with gold clusters were not found in anti-BDNF–labeled (C) or anti–pro-BDNF–labeled (D) MFBs from cbdnf ko mice, confirming the specificity of the signal in WT sections. (E and F) Quantification of BDNF and pro-BDNF immunogold labeling in WT versus cbdnf ko MFBs. MFBs from WT and BDNF-Myc mice (n = 5 for anti-BDNF and n = 4 for anti–pro-BDNF) have a significantly higher density of gold clusters (E) and single gold grains (F) than MFBs from cbdnf ko mice (n = 3). *, P < 0.05; **, P < 0.005. Error bars represent SEM. Bars: (A–D) 500 nm; (A and B, insets) 50 nm.
Figure 5.
Figure 5.
BDNF and pro-BDNF immunogold labeling in preterminal axons. (A) In sections treated with anti-BDNF antibodies, labeled vesicles (arrows and inset) were observed in unmyelinated mossy fiber axons. (B) An electron micrograph showing a mossy fiber terminating into a bouton (dashed outline). The arrow points to an anti–pro-BDNF–labeled vesicle (see inset), which is likely en route to the terminal. ax, axon; sp, dendritic spine. (C) Anti-BDNF labeling of a presynaptic terminal in SR in CA1. Large silver-enhanced gold clusters (arrows) were observed. at, axon terminal. (D) Anti-BDNF staining of sections from cbdnf ko yielded nonspecific background labeling. Bars: (A–D) 500 nm; (A and B, insets) 100 nm.
Figure 6.
Figure 6.
BDNF-IR does not extend beyond proximal dendrites. (A) Myc-IR in the CA3 region showing immunoreactive neuronal somata (asterisks) in the pyramidal cell layer (PCL) and Myc-positive MFB profiles in SL. (B) Anti–MAP-2 staining showing the distribution of pyramidal cell dendrites in CA3. (C) The merged image confirms that Myc-IR is preferentially confined to cell bodies in the pyramidal cell layer and presynaptic terminals in SL. (A–C) Arrows denote limited Myc-IR in proximal apical dendrites. (D–F) High-resolution confocal stack of the DG labeled with antibodies against BDNF (D), pro-BDNF (E), and Arc/Arg3.1 (F). The filled arrows label Arc/Arg3.1-positive, BDNF-negative cells, and the open arrows show BDNF-positive, Arc/Arg3.1-negative cells. GCL, granule cell layer; H, hilus; IML, inner molecular layer. (G) The merged image demonstrates that the majority of granule cells expressing BDNF-IR and pro-BDNF–IR also show Arc/Arg3.1-IR. (H–M) Nonspecific BDNF and pro-BDNF immunogold labeling in dendrites (den). In WT sections labeled with BDNF (H) or pro-BDNF (K) antibodies, gold grains are distributed throughout the dendrites but do not label any specific organelles. In cbdnf ko sections labeled with the same antibodies, a similar gold grain distribution to WT dendrites is observed for both BDNF (I) and pro-BDNF (L) antibodies. Quantification of gold grain density in dendrites reveals no difference between pooled WT/Bdnf-Myc versus cbdnf ko tissues labeled with either BDNF (J) or pro-BDNF (M) antibodies. Error bars represent SEM. Bars: (A–G) 30 µm; (H, I, K, and L) 500 nm.
Figure 7.
Figure 7.
Elevated BDNF staining in Bsn mutants. (A–D) Representative images from CON tissues showing anti-BDNF labeling in the DG (A) and CA3 area (C) and anti–pro-BDNF–Mab5H8 labeling in the DG (B) and CA3 (D). GCL, granule cell layer; H, hilus; IML, inner molecular layer; PCL, pyramidal cell layer. Overall distribution and staining intensities highly resemble those described for WT and Bdnf-Myc animals in Fig. 2. (E–H) In the corresponding regions of Bsn mutant sections, BDNF- and pro-BDNF–Mab5H8-IR are markedly increased in the hilus of the DG (E and F) as well as in SL (G and H). Note that lack of proportional increase in staining in the associated cell layers, namely the GCL (E and F) and pyramidal cell layer of CA3 (G and H). (I and J) High-power examination of the GCL reveals numerous albeit weakly labeled BDNF-positive (I) and pro-BDNF–Mab5H8-positive (J) granule cells, with labeling confined to the cell soma and no detectable dendritic staining in the inner molecular layer. (K and L) In SL of Bsn mutants, an increased density of labeled profiles was observed, with BDNF-IR (K) and pro-BDNF–IR-Mab5H8 (L) showing virtually no overlap with the postsynaptic markers synpo (green; K) and MAP-2 (red; L), respectively. Bars: (A–H) 100 µm; (I and J) 30 µm; (K and L) 15 µm.
Figure 8.
Figure 8.
Higher density of BDNF-positive DCVs in MFBs of Bsn mutant animals. (A and B) Electron micrographs of MFBs from CON sections prelabeled with BDNF (A) or pro-BDNF (B) immunogold. Gold cluster–labeled secretory vesicles were occasionally observed in a subset of terminals (arrows). sp, dendritic spine. (C and D) In MFBs from Bsn mutants, there was an increase in the number of cluster-labeled vesicles (arrows) as well as single gold grains, both in the case of BDNF (C) and pro-BDNF (D) immunogold. den, dendrite. (E and F) This was confirmed by quantification. Error bars represent SEM. Bars, 500 nm.
Figure 9.
Figure 9.
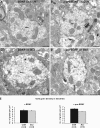
BDNF is not targeted to dendrites in Bsn mutants. (A–E) Comparison of dendrites (den) in SL in CON (A and C) versus Bsn mutant tissues (B and D) revealed a lack of difference in the density of gold grains, both in the case of BDNF immunogold (E, left) and pro-BDNF immunogold (E, right). Also note the general absence of DCVs within dendritic profiles of both CON and Bsn mutant animals. Error bars represent SEM. Bars, 500 nm.
Figure 10.
Figure 10.
Biochemical detection of BDNF, its pro-peptide, and pro-BDNF. IP of hippocampal lysates (500 µg) was performed either with an anti–pro-BDNF antiserum or with the BDNF antibody followed by WB with the antibodies indicated. (A) Both pro-BDNF and its pro-peptide were detected in WT (first lane) but not in cbdnf ko samples (second lane). Similar results were obtained using the pro-BDNF antibody AN-03 in IP and/or WB (not depicted). HIP, hippocampus; IB, immunoblot; non-glyc., nonglycosylated; rec., recombinant. (B) Note that the ratio of pro-peptide to pro-BDNF is similar to that of BDNF and pro-BDNF (n = 3). Error bars represent the SEM of the three samples measured. (C) IP/WB analysis of hippocampal lysates from Bsn mutants reveals a relatively similar increase (approximately threefold) in the levels of BDNF and pro-BDNF (left, second lane) as well as pro-peptide and pro-BDNF (right, second lane) compared with CON tissues (left and right, first lanes). Recombinant BDNF pro-peptide and cleavage-resistant pro-BDNF were used as molecular mass markers.

References

    1. Adachi N., Kohara K., Tsumoto T. 2005. Difference in trafficking of brain-derived neurotrophic factor between axons and dendrites of cortical neurons, revealed by live-cell imaging. BMC Neurosci. 6:42 10.1186/1471-2202-6-42 - DOI - PMC - PubMed
    1. Agassandian K., Gedney M., Cassell M.D. 2006. Neurotrophic factors in the central nucleus of amygdala may be organized to provide substrates for associative learning. Brain Res. 1076:78–86 10.1016/j.brainres.2006.01.009 - DOI - PubMed
    1. Altar C.A., Cai N., Bliven T., Juhasz M., Conner J.M., Acheson A.L., Lindsay R.M., Wiegand S.J. 1997. Anterograde transport of brain-derived neurotrophic factor and its role in the brain. Nature. 389:856–860 10.1038/39885 - DOI - PubMed
    1. Altrock W.D., tom Dieck S., Sokolov M., Meyer A.C., Sigler A., Brakebusch C., Fässler R., Richter K., Boeckers T.M., Potschka H., et al. 2003. Functional inactivation of a fraction of excitatory synapses in mice deficient for the active zone protein bassoon. Neuron. 37:787–800 10.1016/S0896-6273(03)00088-6 - DOI - PubMed
    1. Amaral, D., and P. Lavanex. 2006. Hippocampal Neuroanatomy. In The Hippocampus Book. P. Andersen, R. Morris, D. Amaral, T. Bliss, and J. O’Keefe, editors. Oxford University Press, Oxford. 37–114.

Publication types

Substances