Comparative Study
. 2012 Apr;129(4):e1030-41.
doi: 10.1542/peds.2011-1700. Epub 2012 Mar 12.

Improved outcomes in a quality improvement collaborative for pediatric inflammatory bowel disease

Collaborators, Affiliations
Comparative Study

Improved outcomes in a quality improvement collaborative for pediatric inflammatory bowel disease

Wallace V Crandall et al. Pediatrics. 2012 Apr.

Abstract

Objectives: Unintended variation in the care of patients with Crohn disease (CD) and ulcerative colitis (UC) may prevent achievement of optimal outcomes. We sought to improve chronic care delivery and outcomes for children with inflammatory bowel disease by using network-based quality improvement methods.

Methods: By using a modified Breakthrough Series collaborative structure, 6 ImproveCareNow Network care centers tested changes in chronic illness care and collected data monthly. We used an interrupted time series design to evaluate the impact of these changes.

Results: Data were available for 843 children with CD and 345 with UC. Changes in care delivery were associated with an increase in the proportion of visits with complete disease classification, measurement of thiopurine methyltransferase (TPMT) before initiation of thiopurines, and patients receiving an initial thiopurine dose appropriate to their TPMT status. These were significant in both populations for all process variables (P < .01) except for measurement of TPMT in CD patients (P = .12). There were significant increases in the proportion of CD (55%-68%) and UC (61%-72%) patients with inactive disease. There was also a significant increase in the proportion of CD patients not taking prednisone (86%-90%). Participating centers varied in the success of achieving these changes.

Conclusions: Improvements in the outcomes of patients with CD and UC were associated with improvements in the process of chronic illness care. Variation in the success of implementing changes suggests the importance of overcoming organizational factors related to quality improvement success.


Figures

FIGURE 1
FIGURE 1
Process measures for CD and UC. Top charts show the proportion of monthly visits with a complete standardized assessment bundle; middle charts show the proportion of patients who received a starting dose of thiopurine appropriate to their TPMT status; and bottom charts show the proportion of patients in whom TPMT was measured before initiation of thiopurine. Each chart shows change over time by quarter (Q) and year. Changes in care delivery were associated with improvements in the processes of care.
FIGURE 2
FIGURE 2
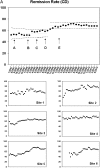
Patients with inactive disease, as assessed by PGA, overall and for each practice site. The top charts are annotated control charts showing monthly results for all centers combined. The dotted centerline represents the mean proportion. The dashed upper and lower control limits reflected the inherent variation in the data and were calculated as ±3 SD of the centerline proportion. The lower charts show results for each center over the same time period. The proportion of patients with inactive disease increased over time. A, uniform practices developed; B, key driver diagram presented, population management report, previsit planning, protocols and auditing, nutrition and growth algorithm; C, standardized assessment bundle; D, Model IBD Care Guideline; E, introduction to self-management support.
FIGURE 2
FIGURE 2
Patients with inactive disease, as assessed by PGA, overall and for each practice site. The top charts are annotated control charts showing monthly results for all centers combined. The dotted centerline represents the mean proportion. The dashed upper and lower control limits reflected the inherent variation in the data and were calculated as ±3 SD of the centerline proportion. The lower charts show results for each center over the same time period. The proportion of patients with inactive disease increased over time. A, uniform practices developed; B, key driver diagram presented, population management report, previsit planning, protocols and auditing, nutrition and growth algorithm; C, standardized assessment bundle; D, Model IBD Care Guideline; E, introduction to self-management support.
FIGURE 3
FIGURE 3
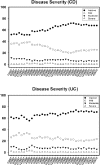
Disease severity for CD and UC (monthly change in disease severity over time). Changes in disease activity were primarily associated with a decrease in the percentage of patients with mild disease.
FIGURE 4
FIGURE 4
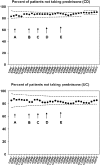
Percent of CD and UC patients not taking prednisone (annotated control charts showing monthly results for all centers combined). The dotted centerline represents the mean proportion. The dashed upper and lower control limits reflected the inherent variation in the data and were calculated as ±3 SD of the centerline proportion. The proportion of CD patients, but not UC patients, increased over time. A, uniform practices developed; B, key driver diagram presented, population management report, previsit planning, protocols and auditing, nutrition and growth algorithm; C, standardized assessment bundle; D, Model IBD Care Guideline; E, introduction to self-management support.
FIGURE 5
FIGURE 5
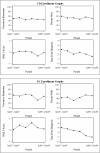
Characteristics of CD and UC patients at the time of enrollment (change in remission rates, gender, BMI, and time from diagnosis for patients enrolled in the study over time). There was no change in gender proportions at the time of enrollment. There was a minor increase in BMI among UC patients. The time from diagnosis to enrollment decreased over the course of the collaborative.

References

    1. Centers for Disease Control and Prevention. Chronic disease prevention and health promotion. Available at: www.cdc.gov/chronicdisease/overview/index.htm. Accessed January 19, 2010
    1. Centers for Disease Control and Prevention. Inflammatory bowel disease (IBD). Available at: www.cdc.gov/nccdphp/dach/ibd.htm. Accessed March 23, 2010
    1. Mackner LM, Sisson DP, Crandall WV. Review: psychosocial issues in pediatric inflammatory bowel disease. J Pediatr Psychol. 2004;29(4):243–257 - PubMed
    1. Gupta N, Cohen SA, Bostrom AG, et al. . Risk factors for initial surgery in pediatric patients with Crohn’s disease. Gastroenterology. 2006;130(4):1069–1077 - PubMed
    1. Boyle B, Mackner L, Ross C, Moses J, Kumar S, Crandall W. A single-center experience with methotrexate after thiopurine therapy in pediatric Crohn disease. J Pediatr Gastroenterol Nutr. 2010;51(6):714–717 - PubMed

Publication types