. 2012 Apr 9;209(4):761-74.
doi: 10.1084/jem.20112095. Epub 2012 Mar 12.

Structural insight into MR1-mediated recognition of the mucosal associated invariant T cell receptor

Affiliations

Structural insight into MR1-mediated recognition of the mucosal associated invariant T cell receptor

Rangsima Reantragoon et al. J Exp Med. .

Abstract

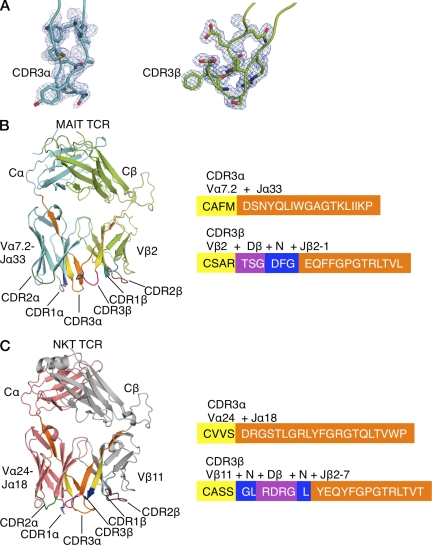
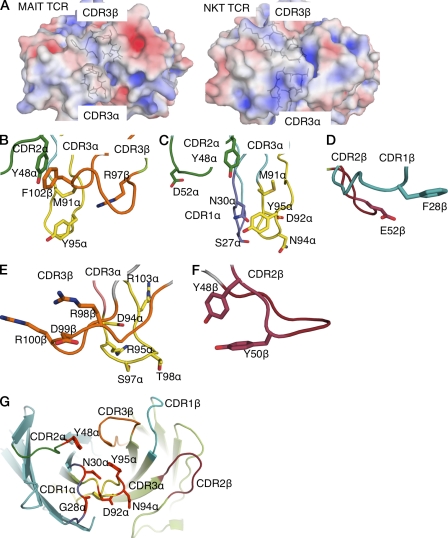
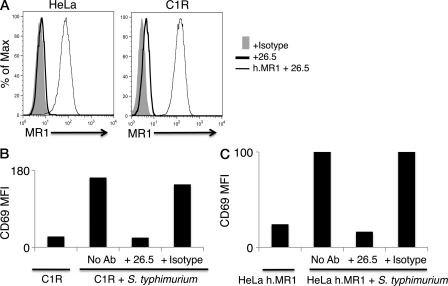
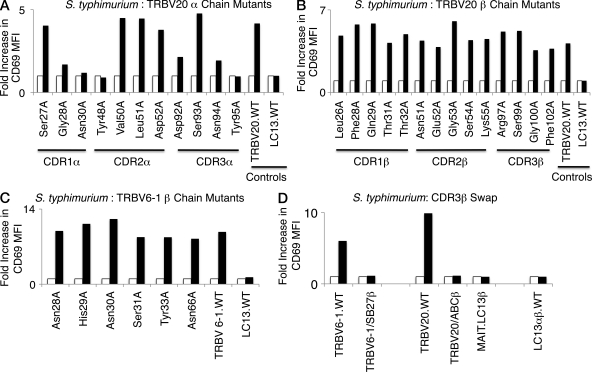
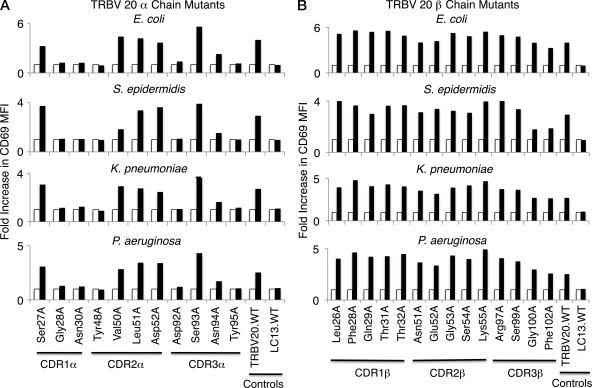
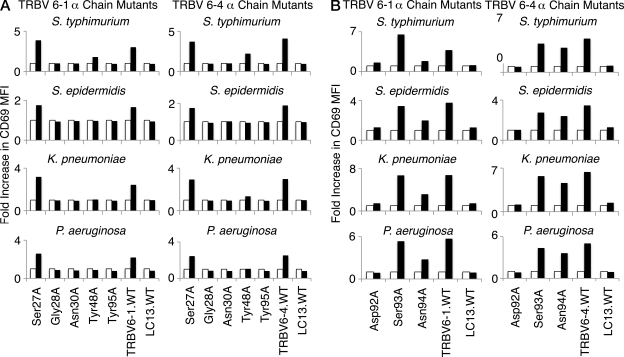
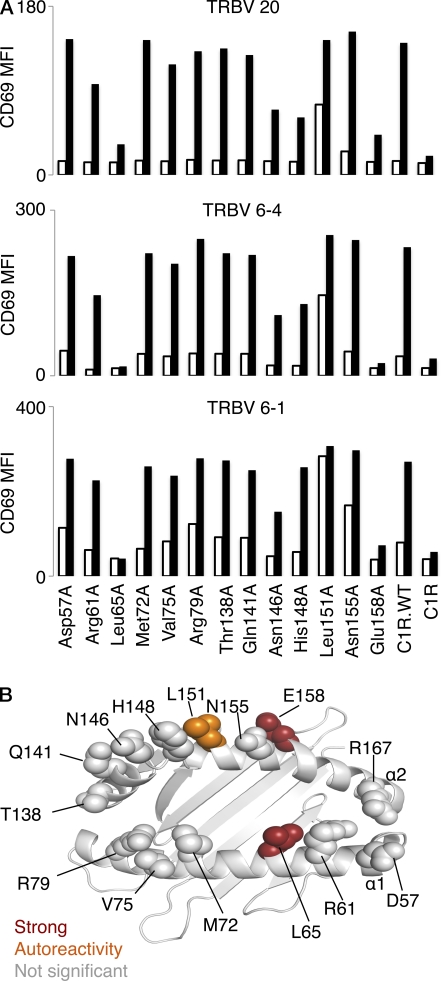
Mucosal-associated invariant T (MAIT) cells express a semiinvariant αβ T cell receptor (TCR) that binds MHC class I-like molecule (MR1). However, the molecular basis for MAIT TCR recognition by MR1 is unknown. In this study, we present the crystal structure of a human Vα7.2Jα33-Vβ2 MAIT TCR. Mutagenesis revealed highly conserved requirements for the MAIT TCR-MR1 interaction across different human MAIT TCRs stimulated by distinct microbial sources. Individual residues within the MAIT TCR β chain were dispensable for the interaction with MR1, whereas the invariant MAIT TCR α chain controlled specificity through a small number of residues, which are conserved across species and located within the Vα-Jα regions. Mutagenesis of MR1 showed that only two residues, which were centrally positioned and on opposing sides of the antigen-binding cleft of MR1, were essential for MAIT cell activation. The mutagenesis data are consistent with a centrally located MAIT TCR-MR1 docking that was dominated by the α chain of the MAIT TCR. This candidate docking mode contrasts with that of the NKT TCR-CD1d-antigen interaction, in which both the α and β chain of the NKT TCR is required for ligation above the F'-pocket of CD1d.


Figures

Figure 1.
Figure 1.
Structures of MAIT and NKT TCRs. (A) 2Fo-Fc electron density map shown as a blue mesh and contoured at 1 sigma for the CDR3α and CDR3β of the MAIT TCR. (B) Structure of MAIT TCR and amino acid composition of CDR3 loops. TCRα chain, cyan; TCRβ chain, light green; CDR1α, purple; CDR2α, dark green; CDR1β, teal, CDR2β, ruby; CDR3 loops, color coded according to their genetic origin (right). (C) Structure of NKT TCR and amino acid composition of CDR3 loops. TCRα chain, salmon; TCRβ chain, gray; CDR loops, color coded as in B.
Figure 2.
Figure 2.
Electrostatic surface and close-up view of CDR loops. (A) Electrostatic calculations were performed using the MAIT TCR and NKT TCR (Protein Data Bank accession code 2EYS). Coordinate preparation was performed using the PDB2PQR server (v1.7; Dolinsky et al., 2007). Electrostatic calculations were subsequently performed using the APBS plug-in in PyMOL (DeLano, 2002; v1.1.0 and v1.2.x, respectively) with 0.15 M concentration for the +1 and −1 ion species. (B) Central binding pocket of the MAIT TCR. CDR2α, dark green; CDR3α, yellow; CDR3β, orange. (C) Residues at the tip of CDRα loops of MAIT TCR. CDR1α, purple; CDR2α and CDR3α, color coded as in B. (D) CDR1β (teal) and CDR2β (ruby) loops of the MAIT TCR. (E) Central binding pocket of the NKT TCR. CDR loops, color coded as in B. (F) Tyrosines of the CDR2β loop (ruby) of the NKT TCR. (G) Energetically important residues at the binding interface of the MAIT TCR. TCR α chain, cyan; TCRβ chain, light green; CDR1α, purple; CDR2α, dark green; CDR3α, yellow; CDR1β, teal, CDR2β, ruby; CDR3β, orange. Energetically important residues are shown in red.
Figure 3.
Figure 3.
Characterization of APC lines and MAIT TCR-transduced T cell lines. (A) Staining of HeLa and C1R cells with the MR1-reactive mAb 26.5 by indirect immunofluorescence. FACS histograms compare intensity of staining with either an isotype control antibody 8A5 (+ Isotype), or with anti-MR1 antibody (+26.5). HeLa and C1R cells transduced with MR1 were also stained with 26.5 (h.MR1 + 26.5). (B) SKW3.TRBV20 cells were incubated with C1R cells infected with Salmonella typhimurium, either in the absence (No Ab) or presence of either an MR1-reactive mAb (+ 26.5) or the HLA class I–reactive mAb W6/32 (+ Isotype). SKW3.TRBV20 cells were subsequently stained for CD69 cell surface expression (mean fluorescence intensity [MFI] values shown) and analyzed by flow cytometry. (C) Jurkat.TRBV6-1 cells were incubated with MR1-transduced HeLa cells infected with S. typhimurium, either in the absence (No Ab) or presence of either an MR1-reactive mAb (+ 26.5) or the HLA class I–reactive mAb W6/32 (+ Isotype). Jurkat.TRBV6-1 cells were subsequently stained for CD69 cell surface expression (MFI values shown) and analyzed by flow cytometry. Experiments in A–C were performed three times, with similar results.
Figure 4.
Figure 4.
Activation of mutant SKW3.BV20 cells by S. typhimurium. 11 mutant α chain (A) and 14 mutant β chain (B) SKW3.TRBV20 cell lines were incubated with C1R cells infected with S. typhimurium at a MOI of 100. Shaded bars show the fold increase in CD69 surface expression (fold increase in MFI) of mutant SKW3.TRBV20 cells co-incubated with C1R cells infected with S. typhimurium compared with SKW3.BV20 cells co-incubated with uninfected C1R cells (open bars). A positive control, wild-type SKW3.TRBV20 (TRBV20.WT), and a negative control, SKW3.LC13 (LC13.WT), were included. The mutant CDR1β Leu26A cell line was included as an internal control where activation was expected to remain intact. (C) MAIT.TRBV6-1 TCRs with six separate solvent-exposed residues of the β chain mutated to alanine were transduced into SKW3 cells and tested in the same manner as the mutant SKW3.TRBV20 cell lines in A and B. (D) SKW3 cells transduced with MAIT TCRs containing CDR3β regions of the MAIT.TRBV6-1 TCR or the MAIT.TRBV20 TCR exchanged with the CDR3β regions of known functional TCRs using TRBV6-1 or TRBV20, respectively, were then tested in the same manner as the mutant SKW3.TRBV20 cell lines in A and B. The following SKW3-transduced cell lines were tested: wild-type SKW3.TRBV6-1 cells (TRBV6-1.WT); SKW3.TRBV6-1 cells with a TCR containing the SB27 TRBV6-1 CDR3β region (TRBV6-1/SB27β); wild-type SKW3.TRBV20 cells (TRBV20.WT); SKW3.TRBV20 cells with a TCR containing the ABC TRBV20 CDR3β region (TRBV20/ABCβ; to be described elsewhere); SKW3 cells with a TCR containing the MAIT invariant α chain paired with the LC13 TCR β chain (MAIT.LC13β); and SKW3 cells with the wild-type LC13 TCR (LC13αβ.WT). The experiments shown in A–D were also performed at an MOI of 1 and 10 and yielded similar results (not depicted). The experiments shown in A and B and C and D were done three times and twice, respectively, with similar results.
Figure 5.
Figure 5.
Activation of mutant SKW3.TRBV20 cell lines by different bacterial species. 11 mutant α chain (A) and 14 mutant β chain (B) SKW3.TRBV20 cell lines were tested for activation by E. coli, S. epidermidis, K. pneumoniae, and P. aeruginosa. Shaded bars show the fold increase in CD69 surface expression (fold increase in MFI) of mutant SKW3.TRBV20 cells co-incubated with C1R cells infected with bacteria at an MOI of 100 compared with SKW3.TRBV20 cells co-incubated with uninfected C1R cells (open bars). The experiments shown in A and B were also performed at an MOI of 1 and 10, with similar results (not depicted). These experiments were performed three times, with similar results.
Figure 6.
Figure 6.
The α chain residues crucial to MAIT TCR recognition are conserved in two other MAIT TCRs. The mutant α chain residues observed to diminish bacterial activation in SKW3.TRBV20 cell lines (Gly28Ala, Asn30Ala, Tyr48Ala, Asp92Ala, Asn94Ala, and Tyr95Ala, as well as control Ser27Ala and Ser93Ala mutations) were introduced into the MAIT.TRBV6-1 and MAIT.TRBV6-4 TCRs before transduction of MAIT TCR genes into SKW3 cells. SKW3.TRBV6-1 and SKW3.TRBV6-4 cell lines transduced with mutants Ser27Ala, Gly28Ala, Asn30Ala, Tyr48Ala, or Tyr95Ala (A), or mutants Asp92Ala, Ser93Ala, or Asn94Ala (B) were then tested for activation by S. typhimurium, S. epidermidis, K. pneumoniae, and P. aeruginosa. Shaded bars show the fold increase in CD69 surface expression (fold increase in MFI) of mutant SKW3.TRBV6-1 or mutant SKW3.TRBV6-4 cells co-incubated with C1R cells infected with bacteria at an MOI of 100 compared with SKW3.TRBV6-1 or SKW3.TRBV6-4 cells co-incubated with uninfected C1R cells (open bars). These experiments were performed three times, with similar results.
Figure 7.
Figure 7.
The effect of mutation of MR1 residues on MAIT TCR activation. (A) 13 mutant MR1, as well as wild-type MR1 (C1R.WT) and parental C1R, cell lines were either not infected (open bars) or infected (shaded bars) with S. typhimurium at a multiplicity of infection (MOI) of 1. After infection, Jurkat.TRBV 20, Jurkat.TRBV 6–1, or Jurkat.TRBV 6–4 cell lines were then added for 16 h before measurement of increase in CD69 surface expression (MFI) by staining and flow cytometric analysis. This experiment was performed twice with similar results. Mutant Arg167Ala MR1 C1R cells activated Jurkat.MAIT cells similarly to wild-type MR1 C1R cells (not depicted). The experiment was also performed at an MOI of 10 with similar results (not depicted). (B) The effects of the MR1 mutants were mapped onto the human MR1 homology model. Mutations that had no impact on MAIT TCR activation is shown in gray; impact on autoreactivity is shown in orange; mutants that markedly reduced MAIT TCR activation are shown in red.

References

    1. Archbold J.K., Macdonald W.A., Burrows S.R., Rossjohn J., McCluskey J. 2008. T-cell allorecognition: a case of mistaken identity or déjà vu? Trends Immunol. 29:220–226 10.1016/j.it.2008.02.005 - DOI - PubMed
    1. Archbold J.K., Macdonald W.A., Gras S., Ely L.K., Miles J.J., Bell M.J., Brennan R.M., Beddoe T., Wilce M.C., Clements C.S., et al. 2009. Natural micropolymorphism in human leukocyte antigens provides a basis for genetic control of antigen recognition. J. Exp. Med. 206:209–219 10.1084/jem.20082136 - DOI - PMC - PubMed
    1. Bendelac A., Savage P.B., Teyton L. 2007. The biology of NKT cells. Annu. Rev. Immunol. 25:297–336 10.1146/annurev.immunol.25.022106.141711 - DOI - PubMed
    1. Bennett-Lovsey R.M., Herbert A.D., Sternberg M.J.E., Kelley L.A. 2008. Exploring the extremes of sequence/structure space with ensemble fold recognition in the program Phyre. Proteins. 70:611–625 10.1002/prot.21688 - DOI - PubMed
    1. Borg N.A., Ely L.K., Beddoe T., Macdonald W.A., Reid H.H., Clements C.S., Purcell A.W., Kjer-Nielsen L., Miles J.J., Burrows S.R., et al. 2005. The CDR3 regions of an immunodominant T cell receptor dictate the ‘energetic landscape’ of peptide-MHC recognition. Nat. Immunol. 6:171–180 10.1038/ni1155 - DOI - PubMed

Publication types

MeSH terms

Substances