. 2012;8(3):e1002404.
doi: 10.1371/journal.pcbi.1002404. Epub 2012 Mar 8.

Epitope flexibility and dynamic footprint revealed by molecular dynamics of a pMHC-TCR complex

Affiliations

Epitope flexibility and dynamic footprint revealed by molecular dynamics of a pMHC-TCR complex

Cyril F Reboul et al. PLoS Comput Biol. 2012.

Abstract

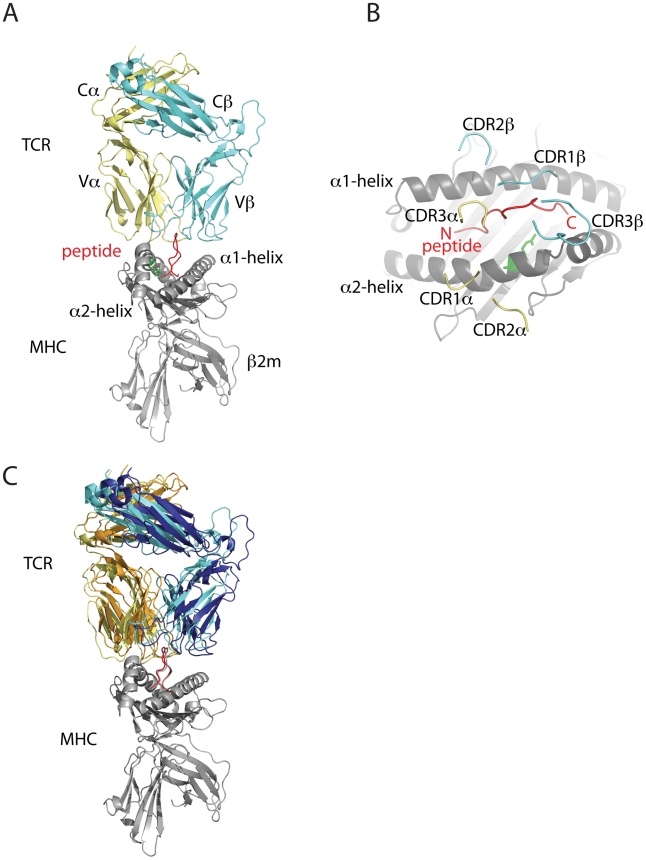
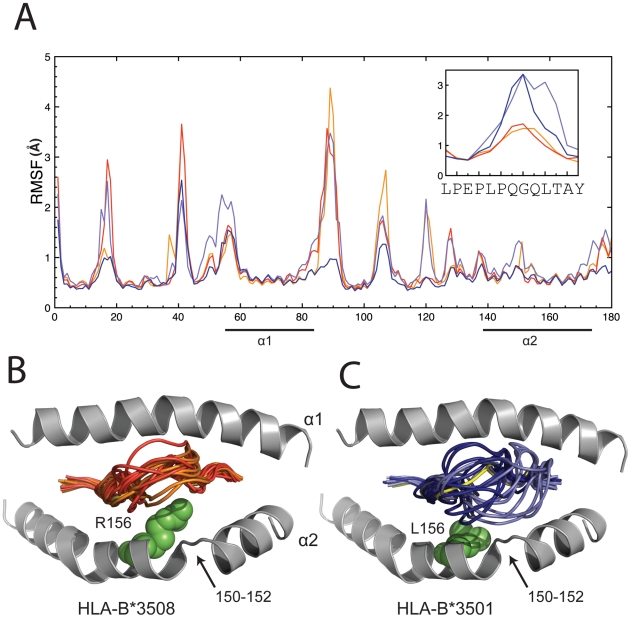
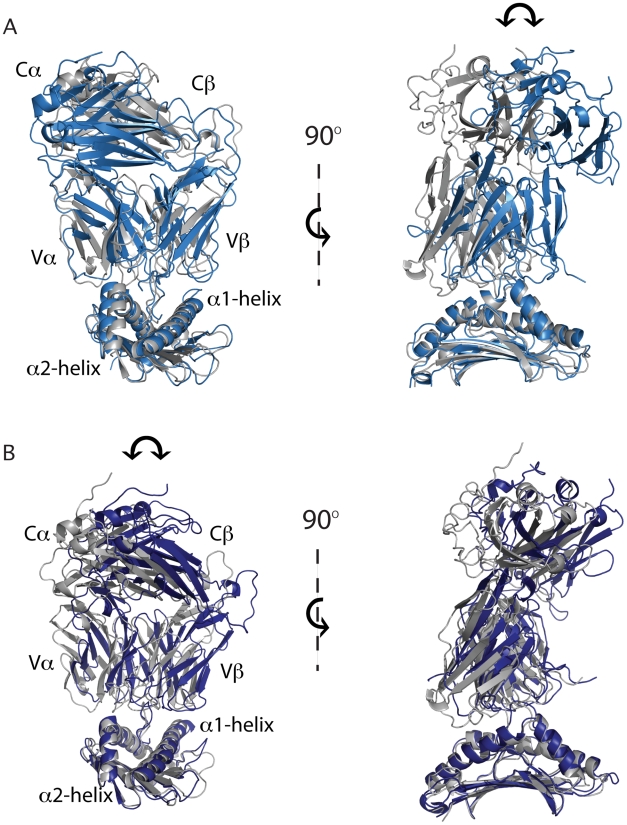
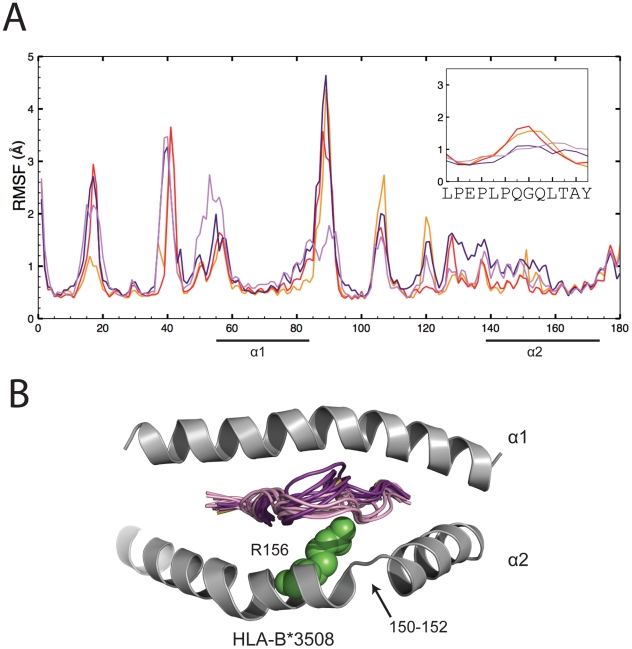
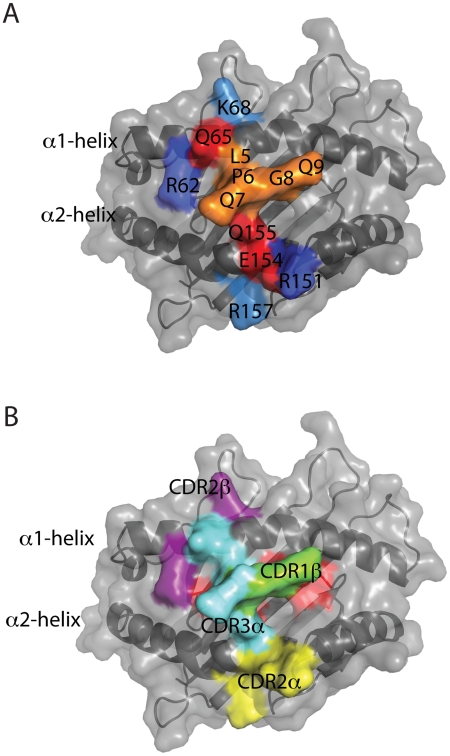
The crystal structures of unliganded and liganded pMHC molecules provide a structural basis for TCR recognition yet they represent 'snapshots' and offer limited insight into dynamics that may be important for interaction and T cell activation. MHC molecules HLA-B*3501 and HLA-B*3508 both bind a 13 mer viral peptide (LPEP) yet only HLA-B*3508-LPEP induces a CTL response characterised by the dominant TCR clonetype SB27. HLA-B*3508-LPEP forms a tight and long-lived complex with SB27, but the relatively weak interaction between HLA-B*3501-LPEP and SB27 fails to trigger an immune response. HLA-B*3501 and HLA-B*3508 differ by only one amino acid (L/R156) located on α2-helix, but this does not alter the MHC or peptide structure nor does this polymorphic residue interact with the peptide or SB27. In the absence of a structural rationalisation for the differences in TCR engagement we performed a molecular dynamics study of both pMHC complexes and HLA-B*3508-LPEP in complex with SB27. This reveals that the high flexibility of the peptide in HLA-B*3501 compared to HLA-B*3508, which was not apparent in the crystal structure alone, may have an under-appreciated role in SB27 recognition. The TCR pivots atop peptide residues 6-9 and makes transient MHC contacts that extend those observed in the crystal structure. Thus MD offers an insight into 'scanning' mechanism of SB27 that extends the role of the germline encoded CDR2α and CDR2β loops. Our data are consistent with the vast body of experimental observations for the pMHC-LPEP-SB27 interaction and provide additional insights not accessible using crystallography.


Conflict of interest statement

The authors have declared that no competing interests exist.

Figures

Figure 1
Figure 1. Overall cartoon of TCR-pMHC complex SB27-HLA-B*3508-LPEP (PDB ID 2AK4).
(A) HLA-B*3508 shown in grey with polymorphic residue (R156) in green, LPEP peptide shown in red, SB27 TCR shown in yellow and cyan for α- and β- chains respectively; (B) Superposition of the two distinct TCR-pMHC complexes within the crystal structure, SB27 α- and β-chains of complex A coloured orange and dark blue respectively and complex B coloured as per (A); (C) aerial view of antigen binding cleft of HLA-B*3508-LPEP with colours as per (A) and the SB27 TCR removed with the exception of the CDR loops.
Figure 2
Figure 2. MHC and peptide conformational flexibility in MD simulations.
(A) RMSFs as calculated from MD simulations for MHC and peptide residues (inset). Only positions 1 to 180 of the MHC molecules are displayed with the MHC helices underlined. HLA-B*3508 simulations 1 and 2 are in red and orange respectively and HLA-B*3501 simulations 1 and 2 are in dark and light blue respectively. The boxed inset highlights the RMSFs of the peptide at positions 1 to 13; (B) Cartoon representation of the crystal structure of HLA-B*3508-LPEP (PDB ID 1ZHL) with helices coloured grey, peptide in yellow and polymorphic residue in green. MD snapshots of the peptide taken every 10 ns and colour coded in red for simulation 1 and orange for simulation 2; (C) Cartoon representation of the crystal structure of HLA-B*3501-LPEP (PDB ID 1ZHK) with helices shown in grey, peptide in yellow and polymorphic residue in green. MD snapshots taken each 10 ns are colour coded dark blue for simulation 1 and light blue for simulation 2.
Figure 3
Figure 3. TCR-pMHC scanning.
The crystal structure of (A) complex A and (B) complex B is in grey for reference and the maximum movement of the TCR during the respective simulations is superposed in light blue or dark blue. Orthogonal orientations are shown in the right hand panels. The arrow highlights the direction of TCR movement during the respective simulations.
Figure 4
Figure 4. The flexibility of the LPEP peptide within HLA-B*3508 while complexed to the SB27 TCR.
(A) RMSFs as calculated from MD simulations for MHC and peptide residues. Only positions 1 to 180 of the MHC molecules are displayed with the MHC helices underlined. HLA-B*3508-LPEP simulations 1 and 2 are in red and orange respectively and HLA-B*3508-LPEP SB27 TCR simulations 1 and 2 are in dark purple and pink respectively. The boxed insert highlights the RMSFs of the peptide at positions 1 to 13; (B) Cartoon representation of the crystal structure of HLA-B*3508-LPEP SB27 TCR complex (PDB ID 2AK4) with helices coloured grey, peptide in yellow and polymorphic residue in green. For clarity the SB27 TCR has been removed. MD snapshots of the peptide taken every 10 ns are colour coded as per A.
Figure 5
Figure 5. The SB27 TCR footprint on HLA-B*3508-LPEP following MD simulation.
(A) A comparison of contacts observed in both the crystal structure and dynamics. MHC or peptide contacts observed in both the crystal structure and dynamics coloured red and orange respectively. Residues coloured in light or dark blue represent novel short-lived (<50%) or long-lived (>50%) interactions respectively that were observed only during the simulation. The footprint represents both complex A and complex B as all contacts were conserved between the two simulations with the exception of Arg157 which was a short-lived contact only observed in the simulation of complex A and Arg151 and Arg162 which were long-lived contacts only observed in the simulation of complex A; (B) The HLA-B*3508 and LPEP residues contacted by the TCR are coloured according to the CDR loop from which they are derived. The uncontacted regions of LPEP are in red, residues contacted by CDR2α in yellow, CDR3α in cyan, CDR1β in green and CDR2β in purple.

References

    1. Kaech SM, Wherry EJ, Ahmed R. Effector and memory T-cell differentiation: implications for vaccine development. Nat Rev Immunol. 2002;2:251–262. - PubMed
    1. Rudolph MG, Luz JG, Wilson IA. Structural and thermodynamic correlates of T cell signaling. Annu Rev Biophys Biomol Struct. 2002;31:121–149. - PubMed
    1. Bankovich AJ, Garcia KC. Not just any T cell receptor will do. Immunity. 2003;18:7–11. - PubMed
    1. Rubtsova K, Scott-Browne JP, Crawford F, Dai S, Marrack P, et al. Many different Vbeta CDR3s can reveal the inherent MHC reactivity of germline-encoded TCR V regions. Proc Natl Acad Sci U S A. 2009;106:7951–7956. - PMC - PubMed
    1. Marrack P, Scott-Browne JP, Dai S, Gapin L, Kappler JW. Evolutionarily conserved amino acids that control TCR-MHC interaction. Annu Rev Immunol. 2008;26:171–203. - PMC - PubMed

Publication types

MeSH terms

Substances