

Mitochondrial variability as a source of extrinsic cellular noise
- PMID: 22412363
- PMCID: PMC3297557
- DOI: 10.1371/journal.pcbi.1002416
Mitochondrial variability as a source of extrinsic cellular noise
Abstract
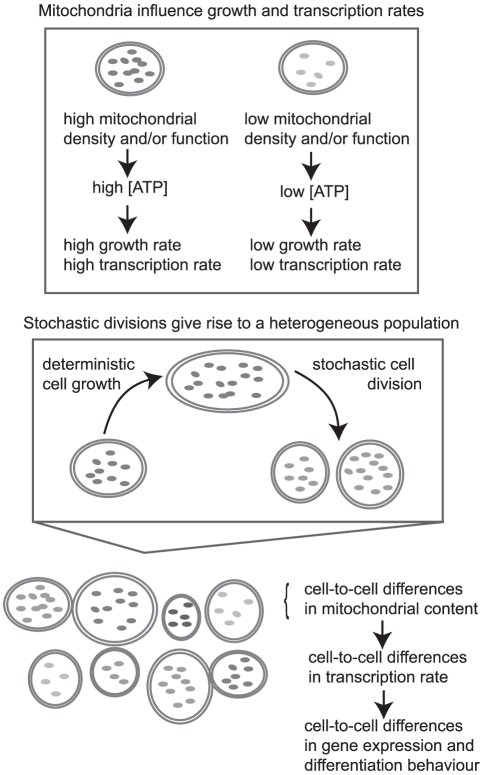
We present a study investigating the role of mitochondrial variability in generating noise in eukaryotic cells. Noise in cellular physiology plays an important role in many fundamental cellular processes, including transcription, translation, stem cell differentiation and response to medication, but the specific random influences that affect these processes have yet to be clearly elucidated. Here we present a mechanism by which variability in mitochondrial volume and functionality, along with cell cycle dynamics, is linked to variability in transcription rate and hence has a profound effect on downstream cellular processes. Our model mechanism is supported by an appreciable volume of recent experimental evidence, and we present the results of several new experiments with which our model is also consistent. We find that noise due to mitochondrial variability can sometimes dominate over other extrinsic noise sources (such as cell cycle asynchronicity) and can significantly affect large-scale observable properties such as cell cycle length and gene expression levels. We also explore two recent regulatory network-based models for stem cell differentiation, and find that extrinsic noise in transcription rate causes appreciable variability in the behaviour of these model systems. These results suggest that mitochondrial and transcriptional variability may be an important mechanism influencing a large variety of cellular processes and properties.
Conflict of interest statement
The authors have declared that no competing interests exist.
Figures

 (for consistency with Ref. [53]) and a mean ATP concentration of
  (from Ref. [70]).
 in an unsynchronised population of cells. B. Distribution of cell volume
  in an unsynchronised population of cells. C. Comparison of the lengths of cell cycles between generations: Gen 1 is the parent cell, Gen 2 the daughter. Cell cycle lengths are only weakly correlated. D. Relationship between the ratio of mitochondrial masses at birth against ratio of cell cycle lengths for sister pairs. E. Relationship between the ratio of cellular volumes at birth and the ratio of cell cycle lengths for sister pairs, showing a weaker correlation than D. F. Transcription rate noise
  in subsets of the population in
  ,
,  , and
, and  phases (see Main Text). G. Mitochondrial mass
  and cell volume
  are strongly correlated in our model. Some experimental evidence is contradictory (see Main Text). H. Distribution of transcription rate per unit volume
  . New experimental data (see
Methods
). I. Distribution of total mitochondrial functionality (
. New experimental data (see
Methods
). I. Distribution of total mitochondrial functionality ( in our model, CMXRos readings from experiments). J. Mean and standard deviation of cell cycle lengths in (A)nti-oxidant-treated, (C)ontrol, and (P)ro-oxidant-treated populations. Experimental histograms, originally presented in arbitrary units, have been scaled to match the mean value of the simulated data.
 (transcription rate),
  (mitochondrial functionality),
  (mitochondrial mass) and
  (cell volume), as a cell grows and divides repeatedly in our model.
 ) and functionality (
 ) on overall transcription rate noise
  . This contour plot shows the value of
  for a given combination of
  . More stochasticity associated with inheritance of mitochondrial properties leads to higher transcription rate noise, and stochasticity in both mass and functional inheritance plays an important role in transcription rate noise. Contour lines on the bottom surface mark different values of
  . The ‘X’ mark denotes the default parameterisation of our model. Other contour lines show that this relationship remains essentially identical when variability due to cell cycle stage and volume inheritance is removed, suggesting that
  and
and  are the key sources of transcription rate noise.
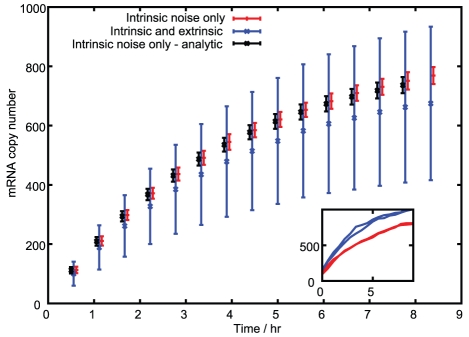
 ) give simulated results without inherited variability. Black (
 ) give analytic results without inherited variability. Blue (
 ) give simulated results with mitochondrial and volume variability, displaying much greater variance in mRNA expression. Bars are slightly offset in the x-direction for clarity. The inset shows two example time series for both simulated cases.
 , in the system corresponding to (A). (F) The equivalent plot of (A) with translation rates independent of
  .
.
 increases through the given values. (A) The structure of the undifferentiated attractor basin in the Huang model given different transcription parameters, showing the widening of the stable undifferentiated region at high transcription rate. (B) The structure of the undifferentiated attractor basin in the Chickarmane model, showing a decrease in undifferentiated basin size as transcription rate increases. The activation-repression structure of both models is illustrated – in (B), external terms representing the activation of GATA1 and X exist but are set to zero in our analysis to allow PU.1 to be expressed under some conditions.
References
Publication types
MeSH terms
Grants and funding
LinkOut - more resources
Full Text Sources
Other Literature Sources
