. 2012;8(3):e1002425.
doi: 10.1371/journal.pcbi.1002425. Epub 2012 Mar 8.

Measured dynamic social contact patterns explain the spread of H1N1v influenza

Affiliations

Measured dynamic social contact patterns explain the spread of H1N1v influenza

Ken T D Eames et al. PLoS Comput Biol. 2012.

Abstract

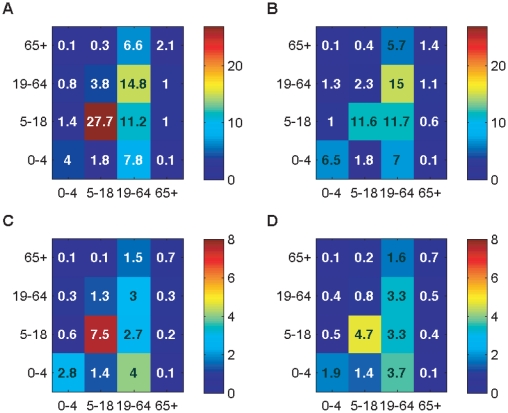
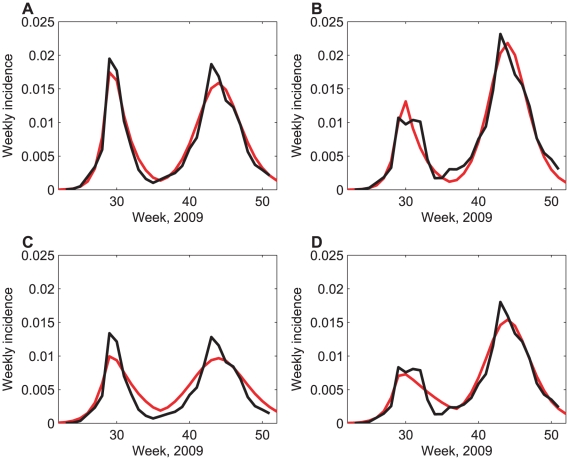
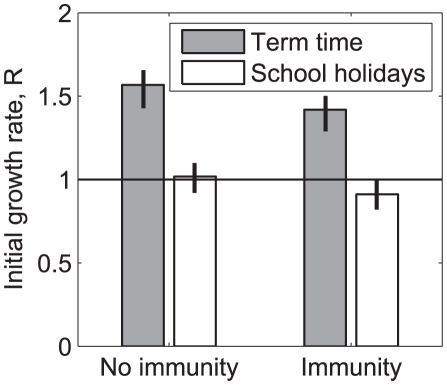
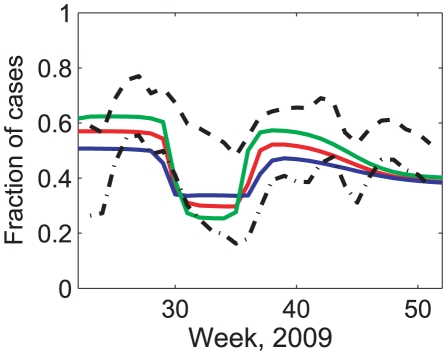
Patterns of social mixing are key determinants of epidemic spread. Here we present the results of an internet-based social contact survey completed by a cohort of participants over 9,000 times between July 2009 and March 2010, during the 2009 H1N1v influenza epidemic. We quantify the changes in social contact patterns over time, finding that school children make 40% fewer contacts during holiday periods than during term time. We use these dynamically varying contact patterns to parameterise an age-structured model of influenza spread, capturing well the observed patterns of incidence; the changing contact patterns resulted in a fall of approximately 35% in the reproduction number of influenza during the holidays. This work illustrates the importance of including changing mixing patterns in epidemic models. We conclude that changes in contact patterns explain changes in disease incidence, and that the timing of school terms drove the 2009 H1N1v epidemic in the UK. Changes in social mixing patterns can be usefully measured through simple internet-based surveys.


Conflict of interest statement

The authors have declared that no competing interests exist.

Figures

Figure 1
Figure 1. Social contact matrices.
Values and colours show the mean number of contacts per day reported between each age group. In each panel, the participant's age group is shown on the vertical axis, that of their contacts on the horizontal axis. The four panels show patterns of A: conversational contacts during school term time; B: conversational contacts during school holidays; C: physical contacts during school term time; D: physical contacts during school holidays.
Figure 2
Figure 2. Incidence estimates, comparing models and data.
A comparison of estimated per-capita weekly incidence data (black) and best-fitting model output (red). The four panels show A: model using patterns of conversational contacts fitted to HPA incidence estimates; B: model using patterns of conversational contacts fitted to flusurvey-adjusted incidence estimates; C: model using patterns of physical contacts fitted to HPA incidence estimates; D: model using patterns of physical contacts fitted to flusurvey-adjusted incidence estimates. Best-fitting parameter sets and fits using bootstrapped matrices can be found in Table S2 in Text S1, and Figs S1 and S2.
Figure 3
Figure 3. The impact of school holidays on epidemic growth rate.
The impact of school holidays and prior immunity on initial epidemic growth rate predicted using the best-fitting model (using patterns of conversational contacts fitted to HPA incidence estimates) considering an epidemic that began during term time or during the school holidays, with and without measured levels of prior immunity. Comparable results from the other models can be found in Table S5 in Text S1. Lines show the range of model predictions using the low-difference and high-difference bootstrapped contact matrices.
Figure 4
Figure 4. Incidence within younger age groups, over time.
The fraction of incidence each week that occurs in younger people, as predicted using the best-fitting model (using patterns of conversational contacts fitted to HPA incidence estimates) and as reported in the HPA incidence estimate data. Incidence data showing the proportion of incidence in those aged under 25 (black, dashed) and under 15 (black, dash-dotted); model predicted fraction of incidence in those aged under 19 is shown in red; model predictions using the low-difference and high-difference bootstrapped contact matrices are shown in green and blue respectively.

References

    1. Health Protection Agency. HPA Weekly National Influenza Report. Report 27 May 2009–25 Mar 2010. 2010. Available from: http://www.hpa.org.uk/web/HPAweb&HPAwebStandard/HPAweb_C/1244442494458.
    1. Baguelin M, van Hoek AJ, Jit M, Flasche S, White PJ, et al. Vaccination against pandemic influenza A/H1N1v in England: A real-time economic evaluation. Vaccine. 2010;28:2370–2384. - PubMed
    1. Keeling M, Rohani P. Modeling infectious diseases in humans and animals. Princeton: Princeton University Press; 2008.
    1. Conlan AJK, Grenfell BT. Seasonality, persistence and the invasion of measles. Proc R Soc B. 2007;274:1133–1140. - PMC - PubMed
    1. Rohani P, Zhong X, King AA. Contact network structure explains the changing epidemiology of pertussis. Science. 2010;330:982–985. - PubMed

Publication types