

Significant association of KIR2DL3-HLA-C1 combination with cerebral malaria and implications for co-evolution of KIR and HLA
- PMID: 22412373
- PMCID: PMC3297587
- DOI: 10.1371/journal.ppat.1002565
Significant association of KIR2DL3-HLA-C1 combination with cerebral malaria and implications for co-evolution of KIR and HLA
Abstract
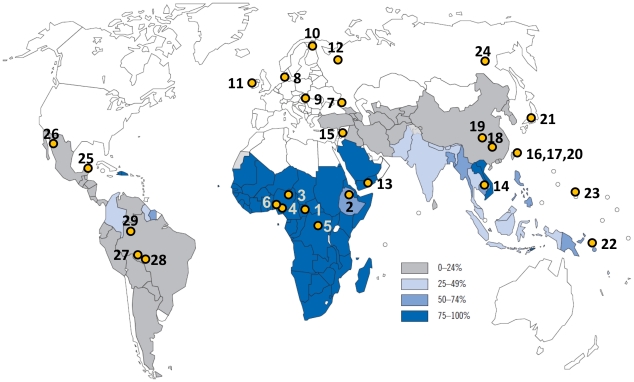
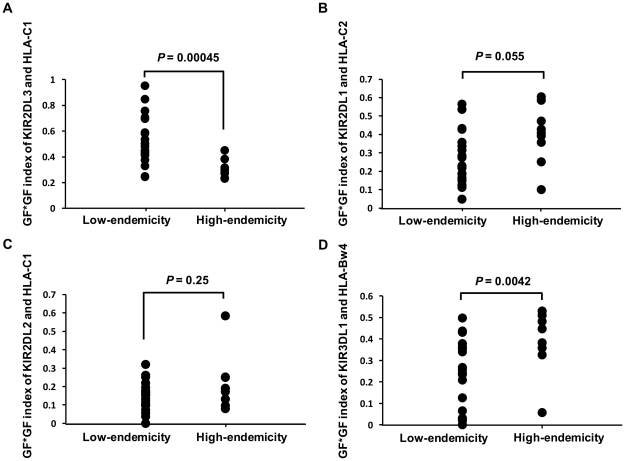
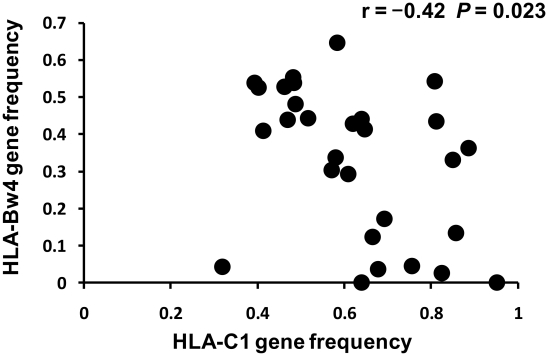
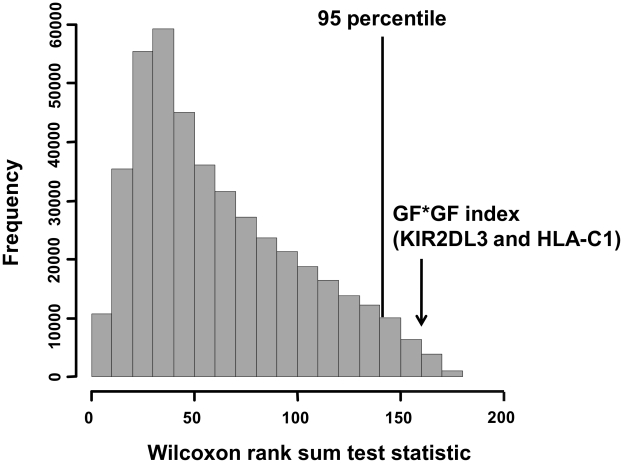
Cerebral malaria is a major, life-threatening complication of Plasmodium falciparum malaria, and has very high mortality rate. In murine malaria models, natural killer (NK) cell responses have been shown to play a crucial role in the pathogenesis of cerebral malaria. To investigate the role of NK cells in the developmental process of human cerebral malaria, we conducted a case-control study examining genotypes for killer immunoglobulin-like receptors (KIR) and their human leukocyte antigen (HLA) class I ligands in 477 malaria patients. We found that the combination of KIR2DL3 and its cognate HLA-C1 ligand was significantly associated with the development of cerebral malaria when compared with non-cerebral malaria (odds ratio 3.14, 95% confidence interval 1.52-6.48, P = 0.00079, corrected P = 0.02). In contrast, no other KIR-HLA pairs showed a significant association with cerebral malaria, suggesting that the NK cell repertoire shaped by the KIR2DL3-HLA-C1 interaction shows certain functional responses that facilitate development of cerebral malaria. Furthermore, the frequency of the KIR2DL3-HLA-C1 combination was found to be significantly lower in malaria high-endemic populations. These results suggest that natural selection has reduced the frequency of the KIR2DL3-HLA-C1 combination in malaria high-endemic populations because of the propensity of interaction between KIR2DL3 and C1 to favor development of cerebral malaria. Our findings provide one possible explanation for KIR-HLA co-evolution driven by a microbial pathogen, and its effect on the global distribution of malaria, KIR and HLA.
Conflict of interest statement
The authors have declared that no competing interests exist.
Figures
References
-
- Marsh K, Forster D, Waruiru C, Mwangi I, Winstanley M, et al. Indicators of life-threatening malaria in African children. N Engl J Med. 1995;332:1399–1404. - PubMed
-
- Hansen DS, Siomos MA, Buckingham L, Scalzo AA, Schofield L. Regulation of murine cerebral malaria pathogenesis by CD1d-restricted NKT cells and the natural killer complex. Immunity. 2003;18:391–402. - PubMed
-
- Hansen DS, Bernard NJ, Nie CQ, Schofield L. NK cells stimulate recruitment of CXCR3+ T cells to the brain during Plasmodium berghei-mediated cerebral malaria. J Immunol. 2007;178:5779–5788. - PubMed
-
- Artavanis-Tsakonas K, Riley EM. Innate immune response to malaria: rapid induction of IFN-gamma from human NK cells by live Plasmodium falciparum-infected erythrocytes. J Immunol. 2002;169:2956–2963. - PubMed
Publication types
MeSH terms
Substances
LinkOut - more resources
Full Text Sources
Other Literature Sources
Research Materials
