. 2012;8(3):e1002574.
doi: 10.1371/journal.ppat.1002574. Epub 2012 Mar 8.

Capsule type of Streptococcus pneumoniae determines growth phenotype

Affiliations

Capsule type of Streptococcus pneumoniae determines growth phenotype

Lucy J Hathaway et al. PLoS Pathog. 2012.

Abstract

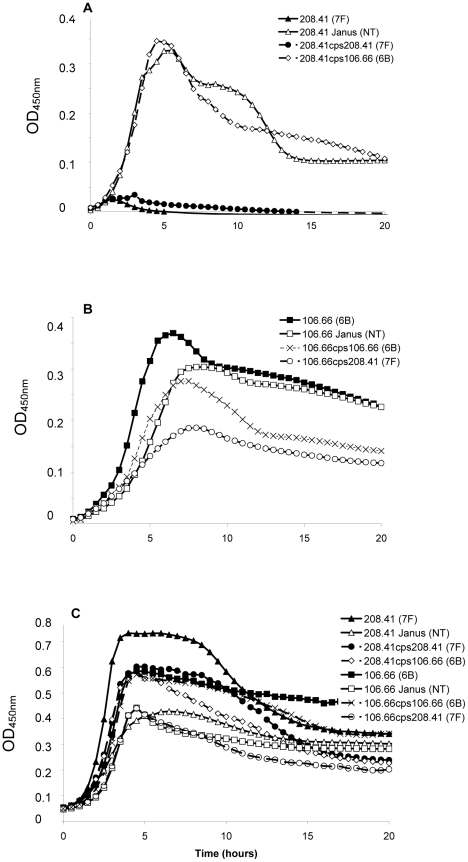
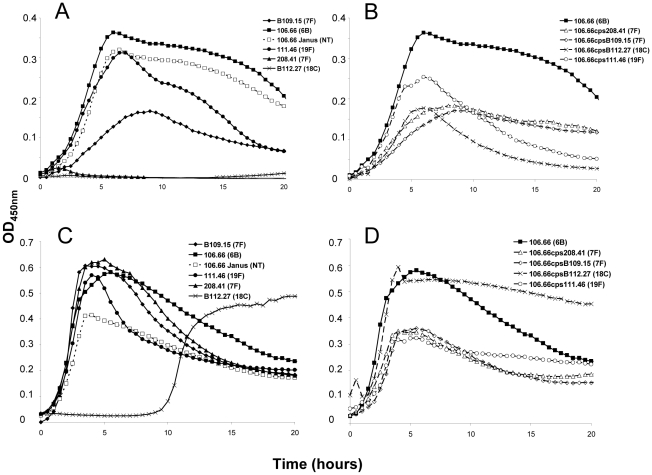
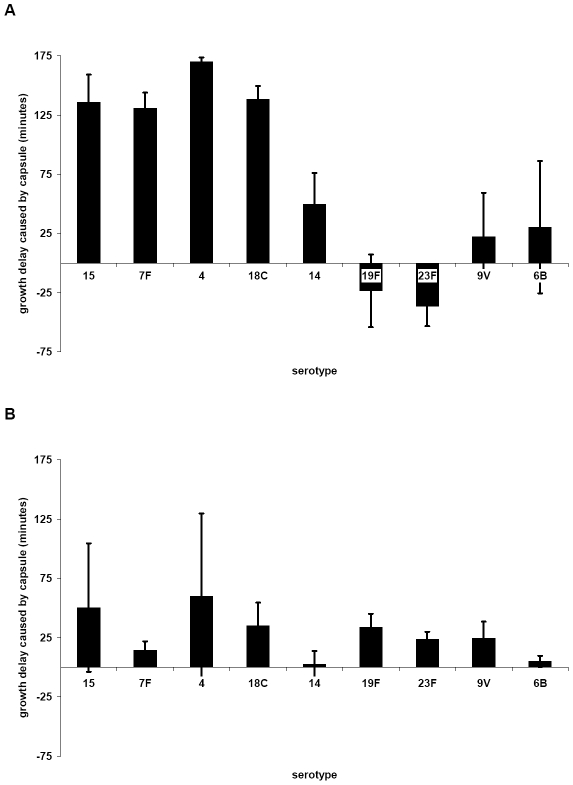
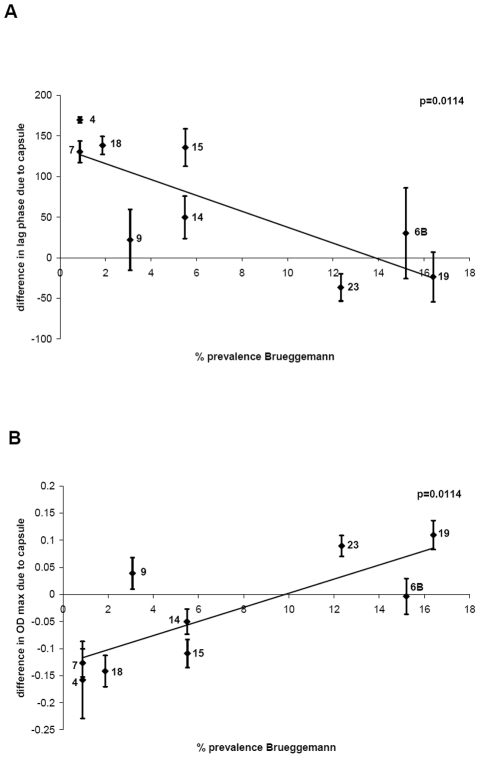
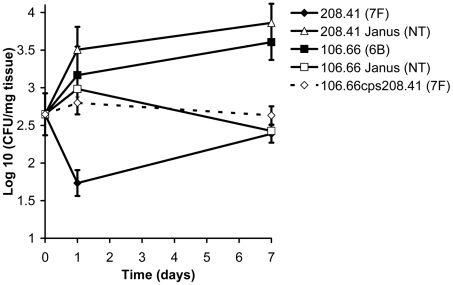
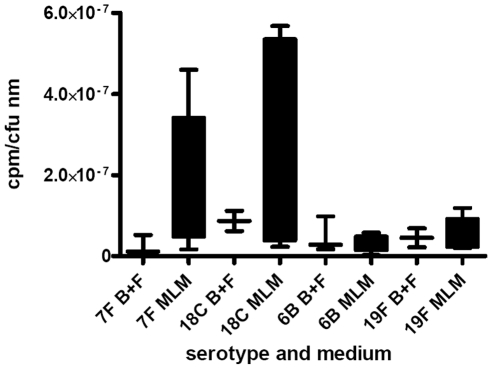
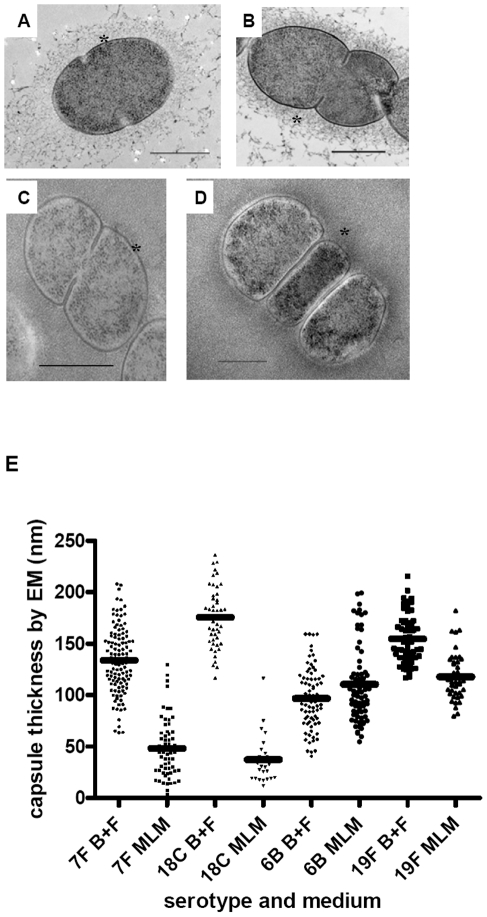
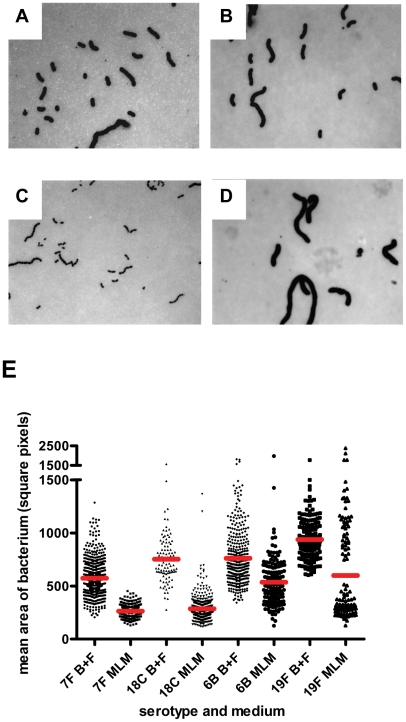
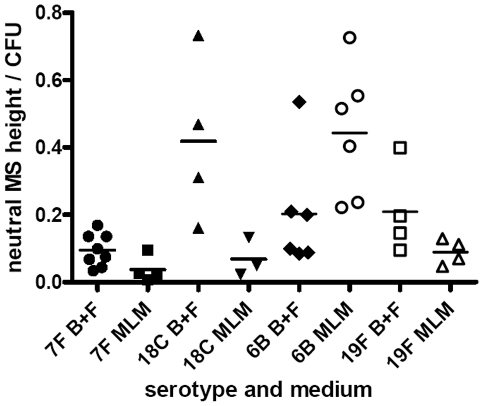
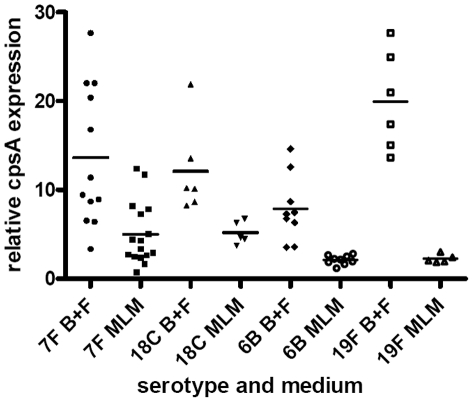
The polysaccharide capsule of Streptococcus pneumoniae defines over ninety serotypes, which differ in their carriage prevalence and invasiveness for poorly understood reasons. Recently, an inverse correlation between carriage prevalence and oligosaccharide structure of a given capsule has been described. Our previous work suggested a link between serotype and growth in vitro. Here we investigate whether capsule production interferes with growth in vitro and whether this predicts carriage prevalence in vivo. Eighty-one capsule switch mutants were constructed representing nine different serotypes, five of low (4, 7F, 14, 15, 18C) and four of high carriage prevalence (6B, 9V, 19F, 23F). Growth (length of lag phase, maximum optical density) of wildtype strains, nontypeable mutants and capsule switch mutants was studied in nutrient-restricted Lacks medium (MLM) and in rich undefined brain heart infusion broth supplemented with 5% foetal calf serum (BHI+FCS). In MLM growth phenotype depended on, and was transferred with, capsule operon type. Colonization efficiency of mouse nasopharynx also depended on, and was transferred with, capsule operon type. Capsule production interfered with growth, which correlated inversely with serotype-specific carriage prevalence. Serotypes with better growth and higher carriage prevalence produced thicker capsules (by electron microscopy, FITC-dextran exclusion assays and HPLC) than serotypes with delayed growth and low carriage prevalence. However, expression of cpsA, the first capsule gene, (by quantitative RT-PCR) correlated inversely with capsule thickness. Energy spent for capsule production (incorporation of H3-glucose) relative to amount of capsule produced was higher for serotypes with low carriage prevalence. Experiments in BHI+FCS showed overall better bacterial growth and more capsule production than growth in MLM and differences between serotypes were no longer apparent. Production of polysaccharide capsule in S. pneumoniae interferes with growth in nutrient-limiting conditions probably by competition for energy against the central metabolism. Serotype-specific nasopharyngeal carriage prevalence in vivo is predicted by the growth phenotype.


Conflict of interest statement

The authors have declared that no competing interests exist.

Figures

Figure 1
Figure 1. Growth patterns of strain 208.41 of serotype 7F and strain 106.66 of serotype 6B and their capsule switch mutants.
A) Loss of 7F capsule greatly increases growth and acquisition of a 6B capsule has no effect on lag phase compared to the nontypeable Janus mutant in MLM. Reacquisition of the 7F capsule reduces growth to that of the wildtype 7F strain. B) Loss of 6B capsule reduces maximum OD450nm and slightly increases lag phase in MLM. Acquisition of a 7F capsule further enhances these effects. Reacquisition of the 6B capsule led to a lag phase between that of the wildtype 6B strain and the Janus mutant. C) In BHI+FCS medium there is little difference in lag phase between the strains or maximum OD450 nm between the wildtype strains. Graphs are representative of three independent experiments.
Figure 2
Figure 2. Growth curves of strain 106.66 (serotype 6B) after replacing 6B capsule operon with operons of different serotypes.
Growth of the wildtypes and nontypeable Janus mutant (A and C) and strain 106.66 with its capsule replaced by that of serotype 7F, 18C or 19F strains (B and D) was measured in MLM (A and B) and BHI+FCS medium (C and D). In MLM, growth of 106.66 was reduced and delayed by acquisition of other capsules. The effect was less for 19F than 7F or 18C reflecting the growth pattern of the wildtype donors. Graphs are representative of three independent experiments.
Figure 3
Figure 3. Influence of capsule serotype on length of lag phase of growth in MLM (A) and BHI+FCS (B).
Change in growth due to the capsule type was calculated as the difference in time to reach an OD450 nm of 0.3 between the non-encapsulated Janus mutant and the strain of the same genetic background but with a new capsule. The average values for each serotype are plotted; error bars represent one standard error. (For serogroup 15 n = 3, for 7F n = 10, for 4 n = 2, for 18C n = 12, for 14 n = 9, for 19F n = 11, for 23F n =  12, for 9V n = 9, for 6B n = 5). The greatest delay of growth in MLM was caused by capsules of serotypes 15, 7F, 4 and 18C, and to a lesser extent 14.
Figure 4
Figure 4. Relationship between growth pattern and carriage prevalence of serotype.
A) For each serotype, the delay of growth due to the capsule was plotted against percentage carriage prevalence data obtained from a previous study and an inverse correlation was found, p = 0.0114. B) For each serotype, the difference in maximum OD450 nm due to the capsule was plotted against percentage carriage prevalence data and a positive correlation was found, p = 0.0114.
Figure 5
Figure 5. Relationship between capsule type and carriage efficiency in a mouse model.
Ability of wildtype strains and mutants to colonize the nasopharynx of female MF1 mice was determined by quantification of colony forming units (CFU) per mg nasopharyngeal tissue on the day of inoculation and 1 and 7 days later. By day 7, the disadvantage of a 7F capsule, but not a 6B capsule, in colonization was apparent. Error bars represent one standard error.
Figure 6
Figure 6. Metabolic burden of capsule was determined by incorporation of 3H-labelled glucose into the capsule.
The fraction of labelled glucose taken up which was detected in the capsule was determined for wildtype strains and capsule switch mutants and the data pooled by serotype and normalized for colony forming units and thickness of capsule. Strains with 7F and 18C capsules incorporated a higher proportion of glucose into their capsules than the high colonization prevalence serotypes 6B and 19F in the MLM (p = 0.0068) but in the BHI+FCS medium there was no significant difference between the serotypes (p = 0.9493).
Figure 7
Figure 7. Electron microscopy showing polysaccharide capsules for measuring capsule thickness.
In BHI+FCS medium (A and B) strains 208.41 (serotype 7F) (A) and 106.66 (serotype 6B) (B) expressed similar amounts of capsule. In MLM (C and D) thicker capsule can be distinguished for 106.66 (6B) (D) than 208.41 (7F) (C). * indicates capsule. Bar = 500 nm. E) Capsule thickness (nm) in wildtypes and capsule switch mutants in BHI+FCS (B+F) medium and in MLM. Capsules were thicker in BHI+FCS than in MEM (p<0.0001) for all serotypes except 6B. In MLM, the high prevalence serotypes 6B and 19F had thicker capsules than the low prevalence serotypes 7F and 18C (p<0.0001). (n per serotype and medium category = 25–118).
Figure 8
Figure 8. FITC-dextran exclusion assay.
In BHI+FCS medium (A and B) strains 208.41 (serotype 7F) (A) and 106.66 (serotype 6B) (B) expressed similar amounts of capsule. In MLM (C and D) strain 106.66 (6B) (D) bacteria are bigger than strain 208.41 (7F) (C). All pictures are to the same scale, original magnification = 630 X. E) Mean area per bacterium (square pixels) was greater in BHI+FCS than in MEM (p<0.0001). In both media bacteria of 6B and 19F serotypes had thicker capsules than bacteria of 7F and 18C serotypes (p<0.0001). (n per serotype and medium category = 96–647).
Figure 9
Figure 9. Quantification of capsule by HPLC.
Cell bound capsular polysaccharides were released from wildtype strains and capsule switch mutants and after hydrolysis resulting in monosaccharides were quantified by reverse phase HPLC. The data was pooled by serotype.
Figure 10
Figure 10. Relative cpsA expression.
CpsA expression is displayed as the value for each isolate relative to that of the isolate with the lowest expression, after normalization using 16S RNA gene expression in BHI+FCS (B+F) medium and in MLM.

References

    1. Jin P, Kong F, Xiao M, Oftadeh S, Zhou F, et al. First report of putative Streptococcus pneumoniae serotype 6D among nasopharyngeal isolates from Fijian children. J Infect Dis. 2009;200:1375–1380. - PubMed
    1. Bentley S, Aanensen D, Mavroidi A, Saunders D, Rabbinowitsch E, et al. Genetic analysis of the capsular biosynthetic locus from all 90 pneumococcal serotypes. PLoS Genet. 2006;2:e31. - PMC - PubMed
    1. Moxon E, Kroll J. The role of bacterial polysaccharide capsules as virulence factors. Curr Top Microbiol Immunol. 1990;150:65–85. - PubMed
    1. Watson D, Musher D. A brief history of the pneumococcus in biomedical research. Semin Respir Infect. 1999;14:198–208. - PubMed
    1. Brueggemann A, Peto T, Crook D, Butler J, Kristinsson K, et al. Temporal and geographic stability of the serogroup-specific invasive disease potential of Streptococcus pneumoniae in children. J Infect Dis. 2004;190:1203–1211. - PubMed

Publication types

MeSH terms

Substances