. 2012;8(3):e1002520.
doi: 10.1371/journal.pgen.1002520. Epub 2012 Mar 8.

Three essential ribonucleases-RNase Y, J1, and III-control the abundance of a majority of Bacillus subtilis mRNAs

Affiliations

Three essential ribonucleases-RNase Y, J1, and III-control the abundance of a majority of Bacillus subtilis mRNAs

Sylvain Durand et al. PLoS Genet. 2012.

Abstract

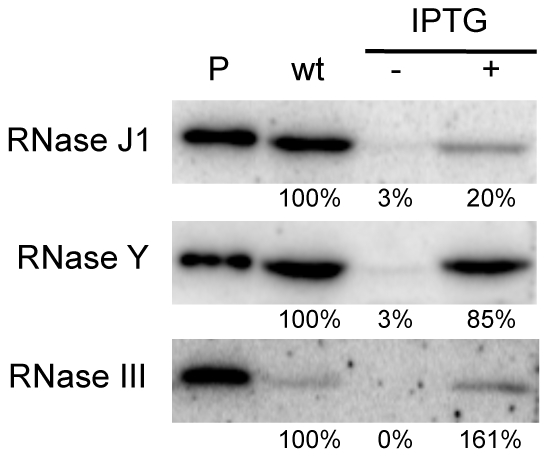
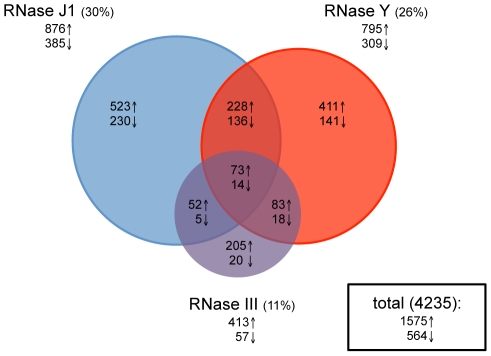
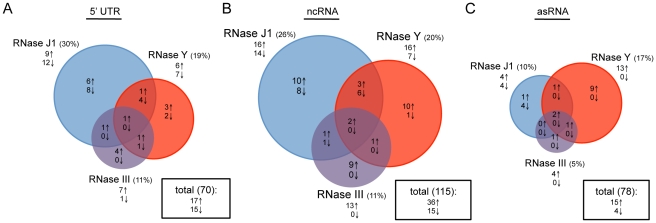
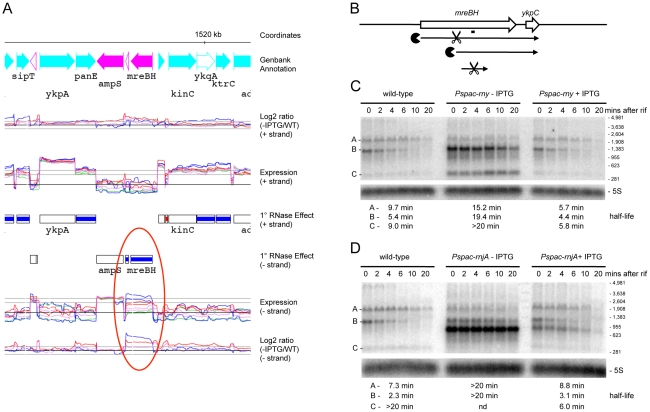
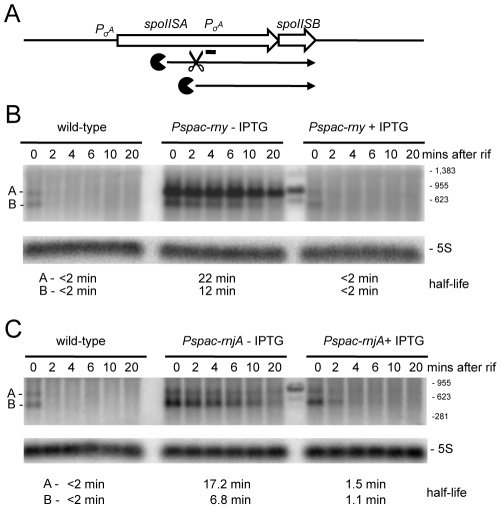
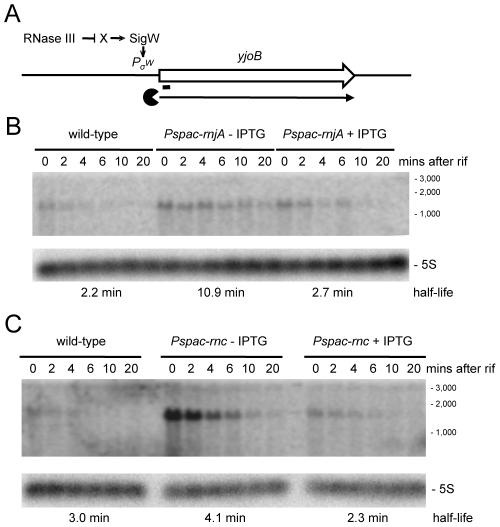
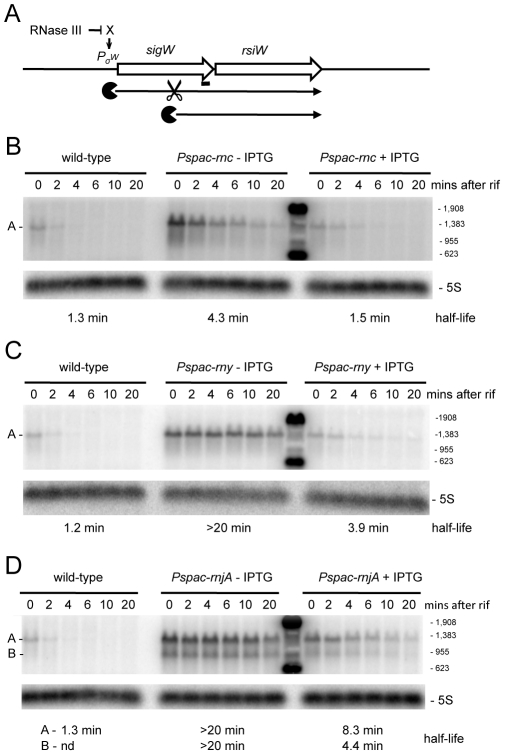
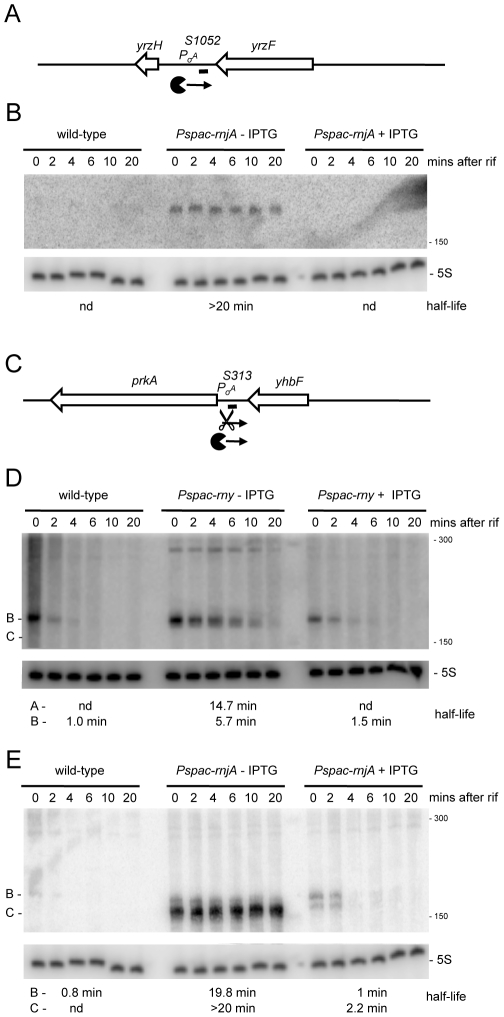
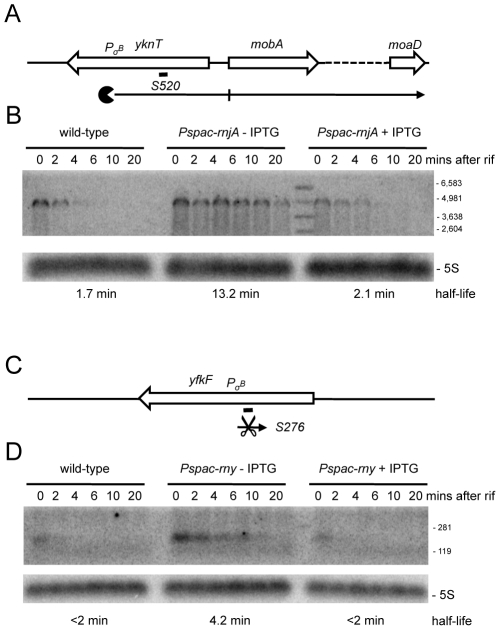
Bacillus subtilis possesses three essential enzymes thought to be involved in mRNA decay to varying degrees, namely RNase Y, RNase J1, and RNase III. Using recently developed high-resolution tiling arrays, we examined the effect of depletion of each of these enzymes on RNA abundance over the whole genome. The data are consistent with a model in which the degradation of a significant number of transcripts is dependent on endonucleolytic cleavage by RNase Y, followed by degradation of the downstream fragment by the 5'-3' exoribonuclease RNase J1. However, many full-size transcripts also accumulate under conditions of RNase J1 insufficiency, compatible with a model whereby RNase J1 degrades transcripts either directly from the 5' end or very close to it. Although the abundance of a large number of transcripts was altered by depletion of RNase III, this appears to result primarily from indirect transcriptional effects. Lastly, RNase depletion led to the stabilization of many low-abundance potential regulatory RNAs, both in intergenic regions and in the antisense orientation to known transcripts.


Conflict of interest statement

The authors have declared that no competing interests exist.

Figures

Figure 1
Figure 1. Western blot analysis of RNase depletion strains.
Lane (P) shows signal from 50 ng purified RNase J1, RNase Y and RNase III proteins. Lanes labeled wt and −/+ IPTG show signals from 10 µg wild type and mutant cell extracts grown in the absence and presence of IPTG.
Figure 2
Figure 2. Effects of RNase J1, Y, and III depletion on abundance of B. subtilis mRNAs.
The Venn diagram shows the number of mRNAs (open reading frames) altered in each of the three mutant strains CCB034 (RNase J1), CCB294 (RNase Y) and CCB288 (RNase III). Upward pointing arrows indicate the number of mRNAs showing increased abundance; downward pointing arrows indicate decreased abundance. The areas of the circles are proportional to the number of mRNAs showing altered abundance in each strain. The total number of mRNAs affected in the experiment is shown in the rectangle to the right of the Venn diagram.
Figure 3
Figure 3. Effects of RNase J1, Y, and III depletion on abundance of B. subtilis regulatory RNAs.
The Venn diagrams show the number of (A) 5′-UTRs, (B) potential ncRNAs and (C) potential asRNAs altered in each of the three mutant strains CCB034 (RNase J1), CCB294 (RNase Y) and CCB288 (RNase III). Upward pointing arrows indicate the number of RNAs showing increased abundance; downward pointing arrows indicate decreased abundance. The areas of the circles are proportional to the number of RNAs showing altered abundance in each strain. The total number of RNAs affected in the experiment is shown in the rectangle to the right of each Venn diagram.
Figure 4
Figure 4. Degradation of the mreBH ykpC mRNA depends on both RNase Y and J1.
(A) Example of trace of the expression data around the mreBH ykpC locus. Lanes are as follows (from top to bottom): (1) Genbank annotation, (2) effect of the depletion of each RNase (log2 ratio −IPTG to wt, calculated on normalized values) on the positive strand, (3) expression signal of wt and RNase depleted strains (normalized log2 values) on the positive strand, (4) summary of the gene-level statistical analysis showing primary (1°) RNase effect (5) expression signal on the negative strand, (6) effect of the depletion of each RNase on the negative strand. The color code for experiments is: wild-type, green; RNase III, violet; RNase J1, blue; RNase Y, red. In the plots of expression signal (lanes 3 and 5), the horizontal black line represents the global median over the whole chromosome and the two horizontal gray lines indicate 5× and 10× this value. In the plots of log2 ratios, the horizontal black line corresponds to base-line (no change) and two horizontal gray lines on either side indicate 2× up and 2× down changes. The summary of the gene-level statistical analysis shows which genes or expression segments were affected by the depletion of at least one of the three RNases: thick green line, gene showing decreased expression in at least one RNase depletion experiment; thick violet, blue or red line, gene showing increased expression in at least one RNase depletion experiment (in this case, the color indicates which depletion was observed to have the greatest effect); thick gray line, gene showing both increased and decreased expression depending on the RNase considered. Color codes for the Genbank annotation are as follows: cyan and magenta, annotated protein coding sequences on the positive and negative strands, respectively (solid symbol when function is known; hollow symbol when function is considered unknown in Genbank); red, ribosomal RNA; dark blue, tRNA; green, Misc_RNA. Traces were plotted using MuGen . Only the signal from unique oligos are shown; gaps are due to non-unique genome sequences. Note: care should be taken when interpreting the log2 ratio signal on the non-coding strand because ratios of values close to background do not have a direct biological interpretation. In particular, these ratios are affected by artifacts such as those caused by reverse transcriptase copying of the cDNA strand, despite the presence of 40 µg/mL actinomycin D in this step. (B) Structure and predicted degradation pathway(s) of the mreBH ykpC transcript. ORFs are shown as large white arrows, transcripts as thin black arrows. Scissors indicate cleavage by RNase Y, ‘Pacman’ symbols represent 5′-3′ degradation by RNase J1. A short thick line indicates the position of the probe used. (C) Northern blot of total mRNA isolated at times after addition of rifampicin (rif) from wild-type and RNase Y depleted (Pspac-rny−IPTG) and RNase Y induced (Pspac-rny+IPTG) cells. The blot was probed with 5′-labeled oligo CCB832 (Table S6) and reprobed with oligo HP246 against 5S rRNA. The half-lives of the different RNA species (A, B, C) from the mreBH ykpC are given under the Northern blot. Migration positions of RNA markers are shown to the right of the blot. (D) Northern blot of total mRNA isolated at times after addition of rifampicin (rif) from wild-type and RNase J1 depleted (Pspac-rnjA−IPTG) and RNase J1 induced (Pspac-rnjA+IPTG) cells. Description as in panel (B); nd is not detected.
Figure 5
Figure 5. Degradation of the spoIISAB mRNA depends on both RNase Y and J1.
(A) Structure and predicted degradation pathway(s) of the spoIISAB transcript. ORFs are shown as large white arrows, transcripts as thin black arrows. Scissors indicate cleavage by RNase Y, ‘Pacman’ symbols represent 5′-3′ degradation by RNase J1. A short thick line indicates the position of the probe used. PσA indicates the approximate promoter position and relevant sigma factor mapped in . (B) Northern blot of total mRNA isolated at times after addition of rifampicin (rif) from wild-type and RNase Y depleted (Pspac-rny−IPTG) and RNase Y induced (Pspac-rny+IPTG) cells. The blot was probed with 5′-labeled oligo CCB826 (Table S6) and reprobed with oligo HP246 against 5S rRNA. The half-lives of the different RNA species (A, B) from the spoIISAB are given under the Northern blot. Migration positions of RNA markers are shown to the right of the blot. Some cross-hybridization to the marker is visible in the lane between the (−) and (+) IPTG samples. (C) Northern blot of total mRNA isolated at times after addition of rifampicin (rif) from wild-type and RNase J1 depleted (Pspac-rnjA−IPTG) and RNase J1 induced (Pspac-rnjA+IPTG) cells. Description as in panel (B).
Figure 6
Figure 6. Degradation of the yjoB mRNA depends on RNase J1 while its transcription is dependent on RNase III.
(A) Structure and predicted degradation pathway of the yjoB transcript. The ORF is shown as a large white arrow, transcript as a thin black arrow. The ‘Pacman’ symbol represent 5′-3′ degradation by RNase J1. A short thick line indicates the position of the probe used. PσW indicates the approximate promoter position and relevant sigma factor mapped in , . The schematic also depicts RNase III initiated degradation of a transcript encoding an unknown factor X early in the SigW cascade. (B) Northern blot of total mRNA isolated at times after addition of rifampicin (rif) from wild-type and RNase J1 depleted (Pspac-rnjA−IPTG) and RNase J1 induced (Pspac-rnjA+IPTG) cells. The blot was probed with 5′-labeled oligo CCB807 (Table S6) and reprobed with oligo HP246 against 5S rRNA. The half-life of the yjoB transcript is given under the Northern blot. Migration positions of RNA markers are shown to the right of the blot. (C) Northern blot of total mRNA isolated at times after addition of rifampicin (rif) from wild-type and RNase III depleted (Pspac-rnc−IPTG) and RNase III induced (Pspac-rnc+IPTG) cells. Description as in panel (B).
Figure 7
Figure 7. Degradation of the sigW-rsiW mRNA depends on RNase Y and RNase J1, while its transcription is dependent on RNase III.
(A) Structure and predicted degradation pathway of the sigW-rsiW transcript. ORFs are shown as large white arrows, transcripts as thin black arrows. Scissors indicate cleavage by RNase Y, ‘Pacman’ symbols represent 5′-3′ degradation by RNase J1. A short thick line indicates the position of the probe used. PσW indicates the approximate promoter position and relevant sigma factor mapped in , . The schematic also depicts RNase III initiated degradation of a transcript encoding an unknown factor X early in the SigW cascade. (B) Northern blot of total mRNA isolated at times after addition of rifampicin (rif) from wild-type and RNase III depleted (Pspac-rnc−IPTG) and RNase III induced (Pspac-rnc+IPTG) cells. The blot was probed with 5′-labeled oligo CCB900 (Table S6) and reprobed with oligo HP246 against 5S rRNA. The half-life of the sigW-rsiW transcript is given under the Northern blot. Migration positions of RNA markers are shown to the right of the blot. Cross-hybridization to the marker is visible in the lane between the (−) and (+) IPTG samples. (C) Northern blot of total mRNA isolated at times after addition of rifampicin (rif) from wild-type and RNase Y depleted (Pspac-rny−IPTG) and RNase Y induced (Pspac-rny+IPTG) cells. Description as in panel (B). (D) Northern blot of total mRNA isolated at times after addition of rifampicin (rif) from wild-type and RNase J1 depleted (Pspac-rnjA−IPTG) and RNase J1 induced (Pspac-rnjA+IPTG) cells. Description as in panel (B).
Figure 8
Figure 8. Detection of new potential regulatory RNAs in RNase Y and J1 mutants.
(A) Structure and predicted degradation pathways of the S1052 RNA. ORFs are shown as large white arrows, transcripts as thin black arrows. ‘Pacman’ symbol represents 5′-3′ degradation by RNase J1. A short thick line indicates the position of the probe used. PσA indicates the putative promoter and sigma factor for the regulatory RNA predicted by the DBTBS website (http://dbtbs.hgc.jp/) and in agreement with the size detected by Northern blot. (B) Northern blot of total mRNA isolated at times after addition of rifampicin (rif) from wild-type and RNase J1 depleted (Pspac-rnjA−IPTG) and RNase J1 induced (Pspac-rnjA+IPTG) cells. The blot was probed with 5′-labeled oligo CCB852 (Table S6) and reprobed with oligo HP246 against 5S rRNA. The half-life of the S1052 transcript is given under the Northern blot (nd is not detected). Migration positions of RNA markers are shown to the right of the blot. (C) Structure and predicted degradation pathway of the S313 RNA. Features as in panel (A); scissors indicate cleavage by RNase Y. (D) Northern blot of total mRNA isolated at times after addition of rifampicin (rif) from wild-type and RNase Y depleted (Pspac-rny−IPTG) and RNase Y induced (Pspac-rny+IPTG) cells. The half-lives of the different RNA species (A, B) containing S313 are given under the Northern blot (nd is not detected). Migration positions of RNA markers are shown to the right of the blot. (E) Northern blot of total mRNA isolated at times after addition of rifampicin (rif) from wild-type and RNase J1 depleted (Pspac-rnjA−IPTG) and RNase J1 induced (Pspac-rnjA+IPTG) cells. The blot was probed with 5′-labeled oligo CCB854 (Table S6) and reprobed with oligo HP246 against 5S rRNA. Description as in panel (D).
Figure 9
Figure 9. Detection of new potential asRNAs in RNase Y and J1 mutants.
(A) Structure and predicted degradation pathways of the S520 RNA antisense to yknT. ORFs are shown as large white arrows, transcripts as thin black arrows. Scissors indicate cleavage by RNase Y, ‘Pacman’ symbols represent 5′-3′ degradation by RNase J1. A short thick line indicates the position of the probe used. PσB indicates the putative promoter and sigma factor for the regulatory RNA predicted by the DBTBS website (http://dbtbs.hgc.jp/) and in agreement with the size detected by Northern blot. (B) Northern blot of total mRNA isolated at times after addition of rifampicin (rif) from wild-type and RNase J1 depleted (Pspac-rnjA−IPTG) and RNase J1 induced (Pspac-rnjA+IPTG) cells. The blot was probed with 5′-labeled oligo CCB857 (Table S6) and reprobed with oligo HP246 against 5S rRNA. The half-life of the S520 transcript is given under the Northern blot. Migration positions of RNA markers are shown to the right of the blot. (C) Structure and predicted degradation pathway of the S276 RNA antisense to yfkF. Features as in panel (A). (D) Northern blot of total mRNA isolated at times after addition of rifampicin (rif) from wild-type and RNase Y depleted (Pspac-rny−IPTG) and RNase Y induced (Pspac-rny+IPTG) cells. The blot was probed with 5′-labeled oligo CCB859 (Table S6) and reprobed with oligo HP246 against 5S rRNA. Description as in panel (B).

References

    1. Carpousis AJ, Luisi BF, McDowall KJ. Endonucleolytic initiation of mRNA decay in Escherichia coli. Prog Mol Biol Transl Sci. 2009;85:91–135. - PubMed
    1. Garrey SM, Mackie GA. Roles of the 5′-phosphate sensor domain in RNase E. Mol Microbiol. 2011;80:1613–1624. - PubMed
    1. Deana A, Celesnik H, Belasco JG. The bacterial enzyme RppH triggers messenger RNA degradation by 5′ pyrophosphate removal. Nature. 2008;451:355–358. - PubMed
    1. Houseley J, Tollervey D. The many pathways of RNA degradation. Cell. 2009;136:763–776. - PubMed
    1. Tomecki R, Dziembowski A. Novel endoribonucleases as central players in various pathways of eukaryotic RNA metabolism. RNA. 2010;16:1692–1724. - PMC - PubMed

Publication types

MeSH terms

LinkOut - more resources