

Chlorogenic acid stimulates glucose transport in skeletal muscle via AMPK activation: a contributor to the beneficial effects of coffee on diabetes
- PMID: 22412912
- PMCID: PMC3296733
- DOI: 10.1371/journal.pone.0032718
Chlorogenic acid stimulates glucose transport in skeletal muscle via AMPK activation: a contributor to the beneficial effects of coffee on diabetes
Abstract
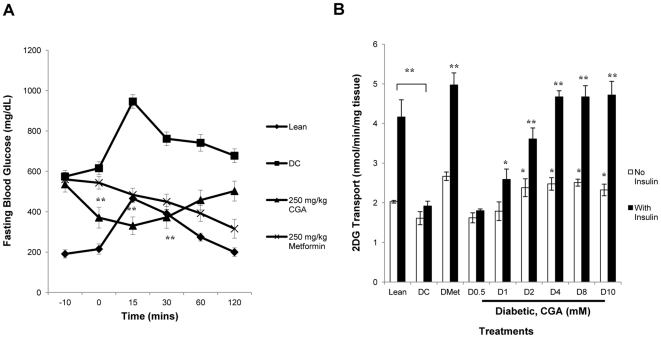
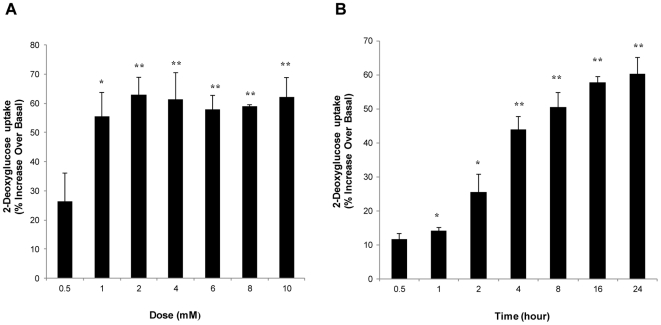
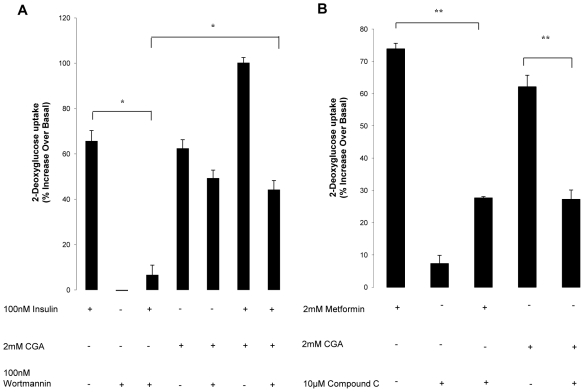
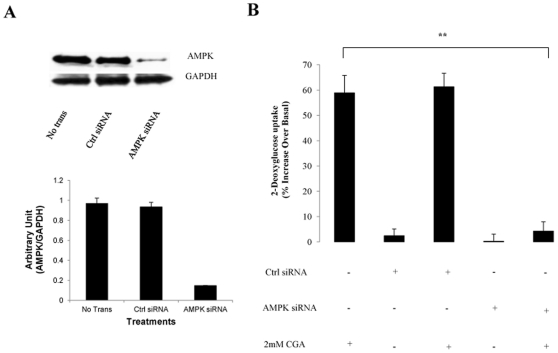
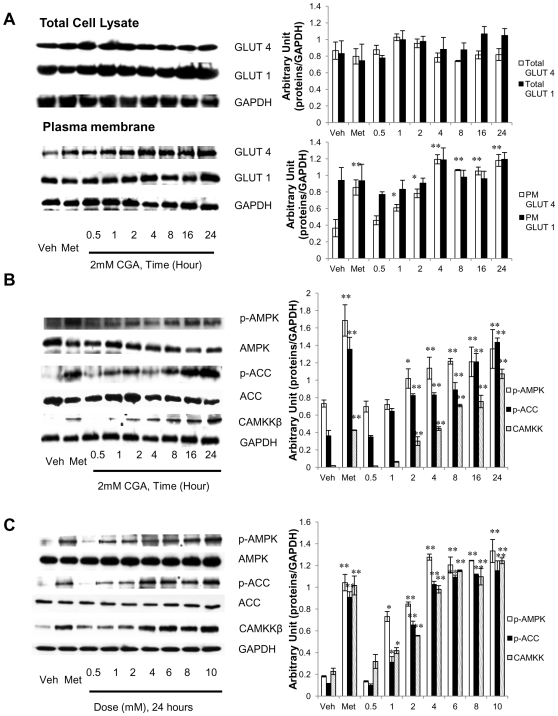
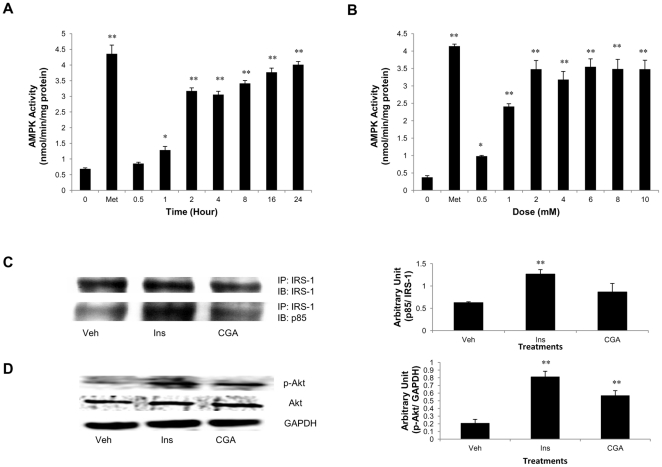
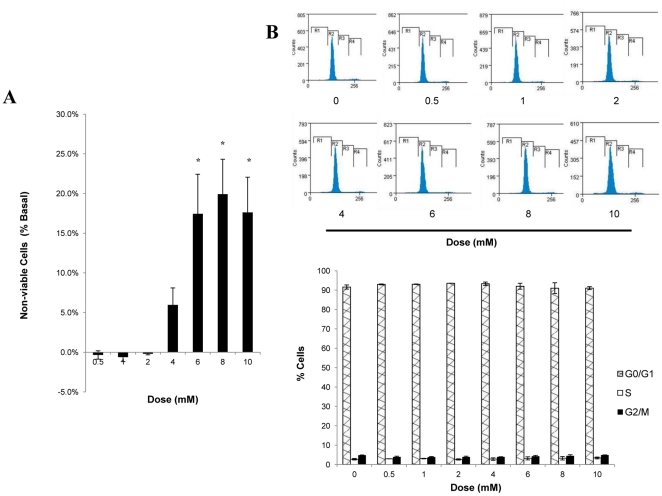
Chlorogenic acid (CGA) has been shown to delay intestinal glucose absorption and inhibit gluconeogenesis. Our aim was to investigate the role of CGA in the regulation of glucose transport in skeletal muscle isolated from db/db mice and L6 skeletal muscle cells. Oral glucose tolerance test was performed on db/db mice treated with CGA and soleus muscle was isolated for 2-deoxyglucose transport study. 2DG transport was also examined in L6 myotubes with or without inhibitors such as wortmannin or compound c. AMPK was knocked down with AMPKα1/2 siRNA to study its effect on CGA-stimulated glucose transport. GLUT 4 translocation, phosphorylation of AMPK and Akt, AMPK activity, and association of IRS-1 and PI3K were investigated in the presence of CGA. In db/db mice, a significant decrease in fasting blood sugar was observed 10 minutes after the intraperitoneal administration of 250 mg/kg CGA and the effect persisted for another 30 minutes after the glucose challenge. Besides, CGA stimulated and enhanced both basal and insulin-mediated 2DG transports in soleus muscle. In L6 myotubes, CGA caused a dose- and time-dependent increase in glucose transport. Compound c and AMPKα1/2 siRNA abrogated the CGA-stimulated glucose transport. Consistent with these results, CGA was found to phosphorylate AMPK and ACC, consistent with the result of increased AMPK activities. CGA did not appear to enhance association of IRS-1 with p85. However, we observed activation of Akt by CGA. These parallel activations in turn increased translocation of GLUT 4 to plasma membrane. At 2 mmol/l, CGA did not cause any significant changes in viability or proliferation of L6 myotubes. Our data demonstrated for the first time that CGA stimulates glucose transport in skeletal muscle via the activation of AMPK. It appears that CGA may contribute to the beneficial effects of coffee on Type 2 diabetes mellitus.
Conflict of interest statement
Figures
Similar articles
-
Anti-diabetic and anti-lipidemic effects of chlorogenic acid are mediated by ampk activation.Biochem Pharmacol. 2013 May 1;85(9):1341-51. doi: 10.1016/j.bcp.2013.02.008. Epub 2013 Feb 14. Biochem Pharmacol. 2013. PMID: 23416115
-
Flavonoids extracted from mulberry (Morus alba L.) leaf improve skeletal muscle mitochondrial function by activating AMPK in type 2 diabetes.J Ethnopharmacol. 2020 Feb 10;248:112326. doi: 10.1016/j.jep.2019.112326. Epub 2019 Oct 19. J Ethnopharmacol. 2020. PMID: 31639486
-
Palmitic acid acutely stimulates glucose uptake via activation of Akt and ERK1/2 in skeletal muscle cells.J Lipid Res. 2011 Jul;52(7):1319-27. doi: 10.1194/jlr.M011254. Epub 2011 Apr 25. J Lipid Res. 2011. PMID: 21518696 Free PMC article.
-
Chlorogenic acid improves food allergy through the AMPK/ACC/CPT-1 pathway.J Food Biochem. 2022 Dec;46(12):e14505. doi: 10.1111/jfbc.14505. Epub 2022 Dec 1. J Food Biochem. 2022. PMID: 36455237 Review.
-
The Effect and Mechanism of Regular Exercise on Improving Insulin Impedance: Based on the Perspective of Cellular and Molecular Levels.Int J Mol Sci. 2025 Apr 28;26(9):4199. doi: 10.3390/ijms26094199. Int J Mol Sci. 2025. PMID: 40362436 Free PMC article. Review.
Cited by
-
Antihyperglycemic, antihyperlipidemic and antioxidant activity of phenolic rich extract of Brassica oleraceae var gongylodes on streptozotocin induced Wistar rats.Springerplus. 2015 May 3;4:212. doi: 10.1186/s40064-015-0948-0. eCollection 2015. Springerplus. 2015. PMID: 26020019 Free PMC article.
-
Gynura divaricata rich in 3, 5-/4, 5-dicaffeoylquinic acid and chlorogenic acid reduces islet cell apoptosis and improves pancreatic function in type 2 diabetic mice.Nutr Metab (Lond). 2018 Oct 10;15:73. doi: 10.1186/s12986-018-0310-y. eCollection 2018. Nutr Metab (Lond). 2018. PMID: 30337946 Free PMC article.
-
AMPK Activity: A Primary Target for Diabetes Prevention with Therapeutic Phytochemicals.Nutrients. 2021 Nov 12;13(11):4050. doi: 10.3390/nu13114050. Nutrients. 2021. PMID: 34836306 Free PMC article. Review.
-
The Association between Coffee Consumption and Risk of Colorectal Cancer in a Korean Population.Nutrients. 2021 Aug 11;13(8):2753. doi: 10.3390/nu13082753. Nutrients. 2021. PMID: 34444913 Free PMC article.
-
Natural products targeting AMPK signaling pathway therapy, diabetes mellitus and its complications.Front Pharmacol. 2025 Feb 3;16:1534634. doi: 10.3389/fphar.2025.1534634. eCollection 2025. Front Pharmacol. 2025. PMID: 39963239 Free PMC article. Review.
References
-
- Agardh EE, Carlsson S, Ahlbom A, Efendic S, Grill V, et al. Coffee consumption, type 2 diabetes and impaired glucose tolerance in Swedish men and women. Journal of Internal Medicine. 2004;255:645–652. - PubMed
-
- Pereira MA, Parker ED, Folsom AR. Coffee consumption and risk of type 2 diabetes mellitus: An 11-year prospective study of 28 812 postmenopausal women. Archives of Internal Medicine. 2006;166:1311–1316. - PubMed
-
- Salazar-Martinez E, Willett WC, Ascherio A, Manson JE, Leitzmann MF, et al. Coffee Consumption and Risk for Type 2 Diabetes Mellitus. Annals of Internal Medicine. 2004;140:1–8+I17. - PubMed
-
- Tuomilehto J, Hu G, Bidel S, Lindström J, Jousilahti P. Coffee Consumption and Risk of Type 2 Diabetes Mellitus among Middle-aged Finnish Men and Women. Journal of the American Medical Association. 2004;291:1213–1219. - PubMed
Publication types
MeSH terms
Substances
LinkOut - more resources
Full Text Sources
Other Literature Sources
Molecular Biology Databases
Research Materials
Miscellaneous
