. 2012;7(3):e32877.
doi: 10.1371/journal.pone.0032877. Epub 2012 Mar 7.

Analysis of human accelerated DNA regions using archaic hominin genomes

Affiliations

Analysis of human accelerated DNA regions using archaic hominin genomes

Hernán A Burbano et al. PLoS One. 2012.

Abstract

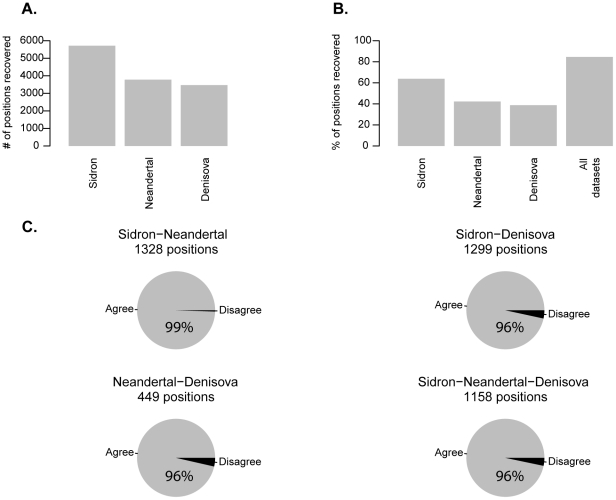
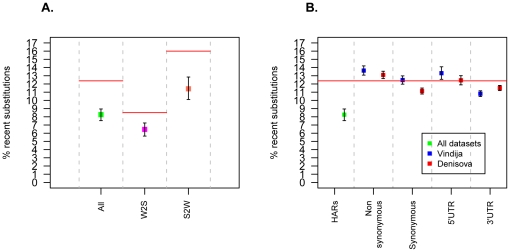
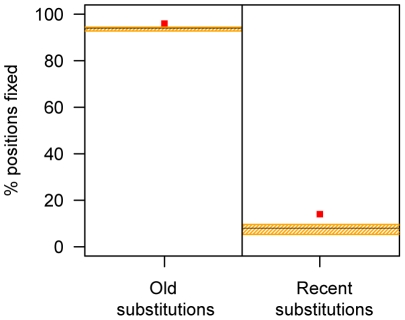
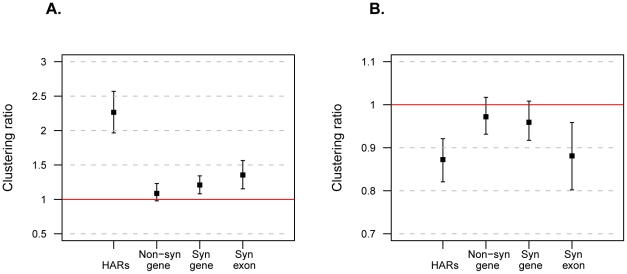
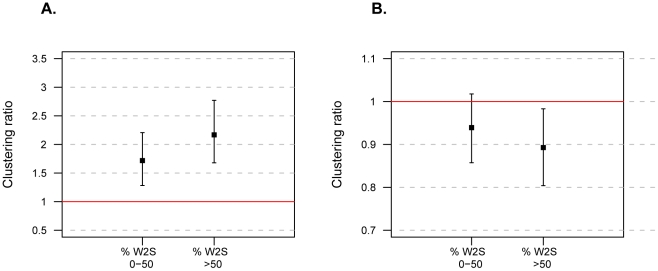
Several previous comparisons of the human genome with other primate and vertebrate genomes identified genomic regions that are highly conserved in vertebrate evolution but fast-evolving on the human lineage. These human accelerated regions (HARs) may be regions of past adaptive evolution in humans. Alternatively, they may be the result of non-adaptive processes, such as biased gene conversion. We captured and sequenced DNA from a collection of previously published HARs using DNA from an Iberian Neandertal. Combining these new data with shotgun sequence from the Neandertal and Denisova draft genomes, we determine at least one archaic hominin allele for 84% of all positions within HARs. We find that 8% of HAR substitutions are not observed in the archaic hominins and are thus recent in the sense that the derived allele had not come to fixation in the common ancestor of modern humans and archaic hominins. Further, we find that recent substitutions in HARs tend to have come to fixation faster than substitutions elsewhere in the genome and that substitutions in HARs tend to cluster in time, consistent with an episodic rather than a clock-like process underlying HAR evolution. Our catalog of sequence changes in HARs will help prioritize them for functional studies of genomic elements potentially responsible for modern human adaptations.


Conflict of interest statement

Competing Interests: The authors have declared that no competing interests exist.

Figures

Figure 1
Figure 1. Substitutions in HARs recovered from the array capture experiment (Sidrón) and two published hominin genomes (Neandertal and Denisova).
(A) Number of substitutions on the human lineage recovered in each dataset. (B) Fraction of substitutions recovered in each dataset and all datasets together. (C) Pie charts of substitutions from all possible overlaps among datasets (agree: datasets have same state; disagree: at least two datasets differ).
Figure 2
Figure 2. Percentage of substitutions in HARs and other functional categories classified as recent.
(A) Recent substitutions in HARs. Boxplots represent all substitutions and substitutions from A/T to G/C (W2S) and from G/C to A/T (S2W) base pairs, respectively. Recent substitutions are defined as those found in modern humans but none of the ancient hominins (determined using Sidrón, Neandertal and Denisova datasets). The red lines show the genome-wide averages. (B) Recent substitutions in different functional categories. Boxplots represent HARs and other categories of genomic elements. Substitutions in HARs are defined as in (a) while substitutions in other categories are defined using either the Neandertal or Denisova genome. In both panels, the red line shows the genome-wide average percentage of recent substitutions (12%). Error bars for HARs are 95% confidence intervals calculated from an empirical bootstrap distribution (1,000 iterations). Error bars for other functional categories are 95% binomial confidence intervals. Colors explained in inset.
Figure 3
Figure 3. Percentages of fixed positions for old and recent substitutions.
The red points show the percentages calculated for HARs, the horizontal black line shows the genome-wide percentage, and the orange shaded areas show 95% confidence intervals for the genome-wide percentage calculated from an empirical distribution after randomly sampling genome-wide HAR-sized elements 1,000 times.
Figure 4
Figure 4. Temporal clustering analysis of HAR substitutions and protein-coding genes.
(A) Clustering ratios for recent substitutions. HAR ratios computed using all datasets, and changes in genes computed from Neandertal and Denisova genomes. Non-syn gene = non-synonymous substitutions in full-length protein sequences; syn gene = synonymous substitutions in full-length protein sequences; syn exon = synonymous substitutions in individual exon sequences. (B) Clustering ratios for old substitutions. In both panels, the red line shows ratio = 1, which indicates an absence of clustering. Error bars are 95% confidence intervals calculated from an empirical distribution after repeating the sample procedure 1,000 times.
Figure 5
Figure 5. Temporal clustering analysis of HARs.
HARs were split in two bins according to their percentage of W2S substitutions: 0 to 50% and >50%. (A) Clustering ratios for recent substitutions of each type. (B) Clustering ratios for old substitutions of each type. In both panels, the red lines and confidence intervals are calculated as in Figure 4.

References

    1. Bird CP, Stranger BE, Liu M, Thomas DJ, Ingle CE, et al. Fast-evolving noncoding sequences in the human genome. Genome Biol. 2007;8:R118. - PMC - PubMed
    1. Bush EC, Lahn BT. A genome-wide screen for noncoding elements important in primate evolution. BMC Evol Biol. 2008;8:17. - PMC - PubMed
    1. Pollard KS, Salama SR, Lambert N, Lambot MA, Coppens S, et al. An RNA gene expressed during cortical development evolved rapidly in humans. Nature. 2006;443:167–172. - PubMed
    1. Prabhakar S, Noonan JP, Paabo S, Rubin EM. Accelerated evolution of conserved noncoding sequences in humans. Science. 2006;314:786. - PubMed
    1. Prabhakar S, Visel A, Akiyama JA, Shoukry M, Lewis KD, et al. Human-specific gain of function in a developmental enhancer. Science. 2008;321:1346–1350. - PMC - PubMed

Publication types