Differential expression of metabolic genes in tumor and stromal components of primary and metastatic loci in pancreatic adenocarcinoma
- PMID: 22412968
- PMCID: PMC3296773
- DOI: 10.1371/journal.pone.0032996
Differential expression of metabolic genes in tumor and stromal components of primary and metastatic loci in pancreatic adenocarcinoma
Abstract
Background: Pancreatic cancer is the fourth leading cause of cancer related deaths in the United States with a five-year survival rate of 6%. It is characterized by extremely aggressive tumor growth rate and high incidence of metastasis. One of the most common and profound biochemical phenotypes of animal and human cancer cells is their ability to metabolize glucose at high rates, even under aerobic conditions. However, the contribution of metabolic interrelationships between tumor cells and cells of the surrounding microenvironment to the progression of cancer is not well understood. We evaluated differential expression of metabolic genes and, hence, metabolic pathways in primary tumor and metastases of patients with pancreatic adenocarcinoma.
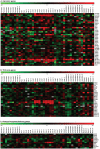
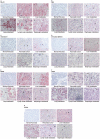
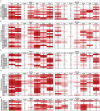
Methods and findings: We analyzed the metabolic gene (those involved in glycolysis, tri-carboxylic acid pathway, pentose-phosphate pathway and fatty acid metabolism) expression profiles of primary and metastatic lesions from pancreatic cancer patients by gene expression arrays. We observed two principal results: genes that were upregulated in primary and most of the metastatic lesions; and genes that were upregulated only in specific metastatic lesions in a site-specific manner. Immunohistochemical (IHC) analyses of several metabolic gene products confirmed the gene expression patterns at the protein level. The IHC analyses also revealed differential tumor and stromal expression patterns of metabolic enzymes that were correlated with the metastasis sites.
Conclusions: Here, we present the first comprehensive studies that establish differential metabolic status of tumor and stromal components and elevation of aerobic glycolysis gene expression in pancreatic cancer.
Conflict of interest statement
Figures


References
-
- Warburg O. On the origin of cancer cells. Science. 1956;123:309–314. - PubMed
-
- Koppenol WH, Bounds PL, Dang CV. Otto Warburg's contributions to current concepts of cancer metabolism. Nat Rev Cancer. 2011;11:325–337. - PubMed
-
- Koukourakis MI, Giatromanolaki A, Harris AL, Sivridis E. Comparison of metabolic pathways between cancer cells and stromal cells in colorectal carcinomas: a metabolic survival role for tumor-associated stroma. Cancer Res. 2006;66:632–637. - PubMed
Publication types
MeSH terms
Substances
Grants and funding
LinkOut - more resources
Full Text Sources
Other Literature Sources
Medical
Molecular Biology Databases

