. 2012;7(3):e33004.
doi: 10.1371/journal.pone.0033004. Epub 2012 Mar 7.

Evidence that Ca2+ within the microdomain of the L-type voltage gated Ca2+ channel activates ERK in MIN6 cells in response to glucagon-like peptide-1

Affiliations

Evidence that Ca2+ within the microdomain of the L-type voltage gated Ca2+ channel activates ERK in MIN6 cells in response to glucagon-like peptide-1

Joanne Selway et al. PLoS One. 2012.

Abstract

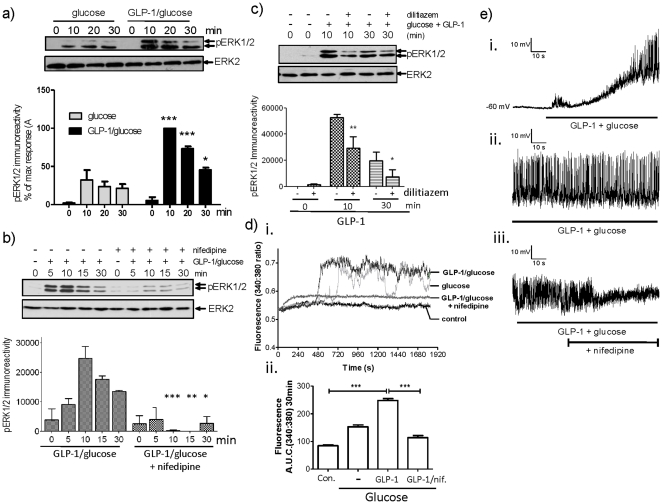
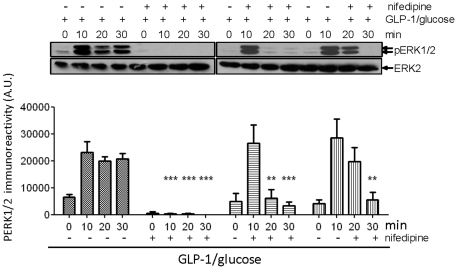
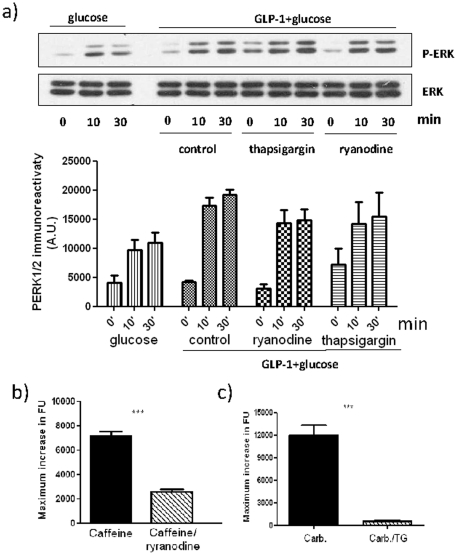
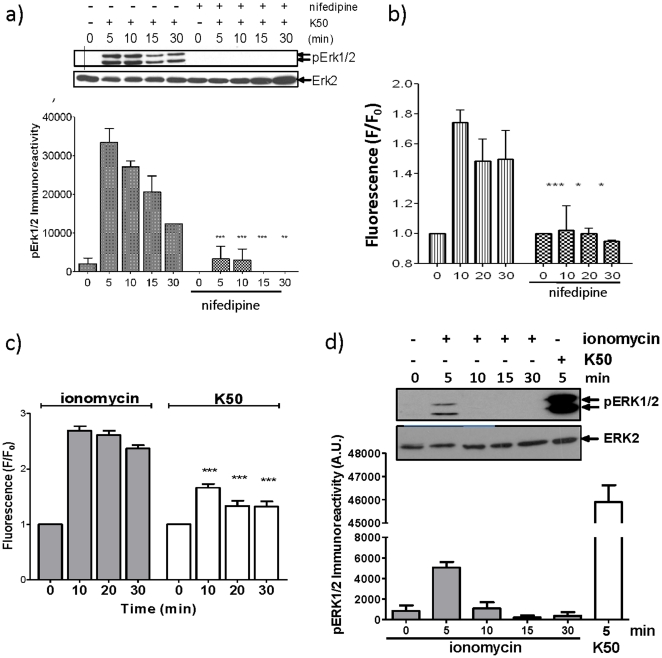
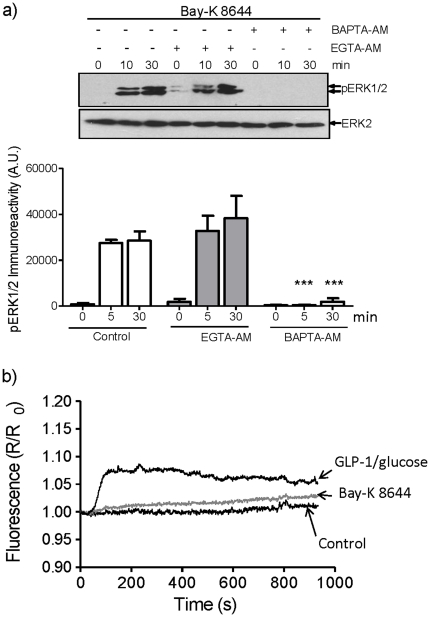
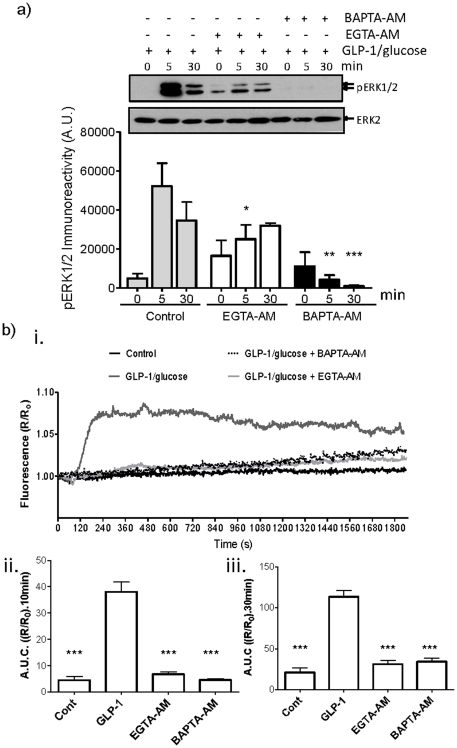
Glucagon like peptide-1 (GLP-1) is released from intestinal L-cells in response to nutrient ingestion and acts upon pancreatic β-cells potentiating glucose-stimulated insulin secretion and stimulating β-cell proliferation, differentiation, survival and gene transcription. These effects are mediated through the activation of multiple signal transduction pathways including the extracellular regulated kinase (ERK) pathway. We have previously reported that GLP-1 activates ERK through a mechanism dependent upon the influx of extracellular Ca(2+) through L-type voltage gated Ca(2+) channels (VGCC). However, the mechanism by which L-type VGCCs couple to the ERK signalling pathway in pancreatic β-cells is poorly understood. In this report, we characterise the relationship between L-type VGCC mediated changes in intracellular Ca(2+) concentration ([Ca(2+)](i)) and the activation of ERK, and demonstrate that the sustained activation of ERK (up to 30 min) in response to GLP-1 requires the continual activation of the L-type VGCC yet does not require a sustained increase in global [Ca(2+)](i) or Ca(2+) efflux from the endoplasmic reticulum. Moreover, sustained elevation of [Ca(2+)](i) induced by ionomycin is insufficient to stimulate the prolonged activation of ERK. Using the cell permeant Ca(2+) chelators, EGTA-AM and BAPTA-AM, to determine the spatial dynamics of L-type VGCC-dependent Ca(2+) signalling to ERK, we provide evidence that a sustained increase in Ca(2+) within the microdomain of the L-type VGCC is sufficient for signalling to ERK and that this plays an important role in GLP-1- stimulated ERK activation.


Conflict of interest statement

Competing Interests: The authors have declared that no competing interests exist.

Figures

Figure 1
Figure 1. GLP-1-stimulated ERK activation requires L-type VGCC activation.
a) MIN6 cells were preincubated for 1 h in KRB supplemented with 1 mM glucose. Cells were then incubated in 16.7 mM glucose in the absence or presence of 10 nM GLP-1. Proteins were resolved by SDS-PAGE and Western blotted using anti-phospho-ERK1/2 (pERK) or anti-ERK2 (ERK2) antibodies. A representative blot is shown above densitometric analysis of the results showing mean +S.E.M. (n = 5). All statistical comparisons were by one-way ANOVA with Bonferroni's multiple comparison test compared to glucose alone at each time point; *, P<0.05; **, P<0.01; ***, P<0.001. b) MIN6 cells were preincubated for 1 h in KRB supplemented with 1 mM glucose. Cells were stimulated with 10 nM GLP-1 plus 16.7 mM glucose in the presence or absence of 10 µM nifedipine for the times indicated. Proteins were resolved by SDS-PAGE and Western blotted using anti-phospho-ERK1/2 and anti-ERK2 antibodies. A representative blot is shown above densitometric analysis of the results showing mean +S.E.M. (n = 3). All statistical comparisons were by one-way ANOVA with Bonferroni's multiple comparison test compared to GLP-1 plus glucose at each time point; *, P<0.05; **, P<0.01; ***, P<0.001. c) MIN6 cells were preincubated for 1 h in KRB supplemented with 1 mM glucose. Cells were stimulated with 10 nM GLP-1 plus 16.7 mM glucose in the presence or absence of 50 µM dilitiazem for the times indicated. Cell lysates were analysed by SDS-PAGE and Western blotting using anti-phospho-ERK1/2 or anti-ERK2 antibodies. A representative blot is shown above densitometric analysis of the results ± S.E.M. All statistical comparisons were by one-way ANOVA with Bonferroni's multiple comparison test compared to glucose plus GLP1; *, P<0.05; **, P<0.01; (n = 3). d) MIN-6 cells were loaded with fura-2-AM and [Ca2+]i levels measured using epifluorescence microscopy. i) Representative traces from single cells incubated with 1 mM glucose (control), 16.7 mM glucose (glucose), 10 nM GLP-1 plus 16.7 mM glucose (GLP-1/glucose) or 10 nM GLP-1 plus 16.7 mM glucose in the presence of 10 µM nifedipine (GLP-1/glucose + nifedipine). ii) Area under the curve (A.U.C.) across the 30 min stimulation showing mean +S.E.M. (n>30). Statistical comparisons were by one-way ANOVA with Dunnett's range test compared to GLP-1 plus glucose; ***, P<0.001. e) Membrane potential recordings from MIN6 cells recorded in the perforated-patch, current-clamp mode. i) The effect of addition of 10 nM GLP-1 plus 16.7 mM glucose on membrane potential. ii) A membrane potential recording after 5.5 min in the continuous presence of 10 nM GLP-1 and 16.7 mM glucose. iii) After 10 min in the presence of 10 nM GLP-1 and 16.7 mM glucose, the effect on excitability of bath application of nifedipine (10 µM) was recorded.
Figure 2
Figure 2. The sustained activation of L-type VGCCs is required for the sustained activation of ERK.
MIN6 cells were preincubated for 1 h in KRB supplemented with 1 mM glucose. The cells were then incubated in KRB containing 10 nM GLP-1 and 16.7 mM glucose in the absence or presence of 10 µM nifedipine applied at either 0, 10 or 20 min post-GLP-1/glucose addition. Proteins were resolved by SDS-PAGE and Western blotted using anti-phospho-ERK1/2 (pERK) and anti-ERK2 (ERK2) antibodies. A representative blot is shown with densitometric analysis of the results below showing mean +S.E.M. (n = 3). Results were analysed using two-way ANOVA with Bonferroni's multiple comparison test compared to GLP-1 plus glucose; **, P<0.01; ***, P<0.001.
Figure 3
Figure 3. The role of intracellular Ca2+ stores in GLP-1-stimulated ERK activation.
a) MIN6 cells were either pre-incubated in KRB supplemented with 1 mM glucose in the absence (control) or presence of 100 µM ryanodine or 1 µM thapsigargin for 30 min prior to treatment with 10 nM GLP-1 plus 16.7 mM glucose for the times indicated. Where indicated, cells were also treated with 16.7 mM glucose alone. Proteins were separated by SDS-PAGE and Western blotted using anti-phospho-ERK1/2 (pERK) and anti-ERK1/2 (ERK1/2) antibodies. A representative blot is shown with densitometric analysis of the results below showing mean +S.E.M. (n = 3). Data were analysed by two-way ANOVA with Bonferroni's multiple comparison test compared to GLP-1 plus glucose at each time point. No significant differences were observed. b) MIN6 cells incubated in the absence of extracellular Ca2+ calcium were preincubated without or with 100 µM ryanodine for 30 min prior to the addition 10 mM caffeine. Changes in fluorescence as an index of [Ca2+]i were determined in fluo-4-loaded cells using a NOVOstar platereader. c) MIN6 cells incubated in the absence of extracellular Ca2+ were pretreated without or with 1 µM thapsigargin for 30 min prior to the addition 100 µM carbachol (Carb.) . Changes in [Ca2+]i were determined in fluo-4-loaded cells using a NOVOstar platereader ***, P<0.001 by Student's t test.
Figure 4
Figure 4. A sustained global increase in [Ca2+]i is insufficient for the prolonged activation of ERK.
(a and b) MIN6 cells were preincubated for 1 h in KRB supplemented with 1 mM glucose. Cells were incubated in 50 mM K+ (K50) in the presence or absence of 10 µM nifedipine for the times indicated (All statistical comparisons were by one-way ANOVA with Bonferroni's multiple comparison test compared to K50 at each time point; *, P<0.05; **, P<0.01; ***, P<0.001). a) Proteins were resolved by SDS-PAGE and Western blotted using anti-phospho-ERK1/2 and anti-ERK2 antibodies. A representative blot is shown above densitometric analysis of the results showing mean +S.E.M. (n = 3). b) In cells loaded with 2 µM fluo-4-AM, fluorescence (as an index of [Ca2+]i) was measured using a NOVOstar platereader. (c and d) MIN6 cells were preincubated for 1 h in KRB supplemented with 1 mM glucose. Cells were then treated with 10 µM ionomycin or 50 mM K+ (K50) for the times indicated. c) In cells loaded with 2 µM fluo-4-AM, fluorescence (as an index of [Ca2+]i) was measured using a NOVOstar platereader. ***, P<0.001 for K50 versus ionomycin at equivalent time points. d) After treatments, proteins were resolved by SDS-PAGE and Western blotted using anti-phospho-ERK1/2 (pERK) or anti-ERK2 (ERK2) antibodies. A representative blot is shown with densitometric analysis of the results below showing mean +S.E.M. (n = 3).
Figure 5
Figure 5. L-type VGCC activation is sufficient to mediate sustained ERK activation in MIN6 cells via local Ca2+ signalling.
MIN6 cells incubated in KRB plus 2 mM glucose were loaded with 100 µM of EGTA-AM or BAPTA-AM prior to treatment with 10 µM Bay-K 8644 at room temperature for the times indicated. a) Proteins were resolved by SDS-PAGE and Western blotted using anti-phospho-ERK1/2 (pERK) or anti-ERK2 (ERK2) antibodies. A representative blot is shown with densitometric analysis of the results below showing mean +S.E.M. (n = 4). Results were analysed by two-way ANOVA with Bonferroni's multiple comparison test compared to Bay-K 8644 alone at each time point; ***, P<0.001. b) MIN6 cells were treated as in (a) but in addition were loaded with 2 µM fura-2-AM and [Ca2+]i levels measured by epifluorescence microscopy (n>30). A mean trace is shown. In addition, a representative trace obtained from MIN6 cells stimulated with 10 nM GLP-1 plus 16.7 mM glucose was included for comparison.
Figure 6
Figure 6. GLP-1-stimulated ERK activation in MIN6 cells is mediated via local Ca2+ signalling.
MIN6 cells incubated in KRB plus 1 mM glucose were loaded with 100 µM EGTA-AM or BAPTA-AM at room temperature prior to treatment with 10 nM GLP-1 plus 16.7 mM glucose for the times indicated. a) Proteins were resolved by SDS-PAGE and Western blotted using anti-phospho-ERK1/2 (pERK) and anti-ERK2 (ERK2) antibodies. A representative blot is shown with densitometric analysis of the results below showing mean +S.E.M. (n = 3). Data were analysed by two-way ANOVA with Bonferroni's multiple comparison test compared to GLP-1 plus glucose at each time point; *, P<0.05; **, P<0.01; ***, P<0.001. b) MIN6 cells were treated as in a) but in addition, loaded with 2 µM fura-2-AM and [Ca2+]i levels measured by epifluorescence microscopy. i) The mean increase in [Ca2+]i represented as area under the curve (A.U.C.) during ii) 10 min or iii) 30 min stimulation, mean +S.E.M. (n>30). Statistical comparisons were by one-way ANOVA with Dunnett's range test compared to GLP-1 plus glucose in the absence of chelator. ***, P<0.001.

References

    1. Perfetti R, Merkel P. Glucagon-like peptide-1: a major regulator of pancreatic beta-cell function. Eur J Endocrinol. 2000;143:717–725. - PubMed
    1. Doyle ME, Egan JM. Mechanisms of action of glucagon-like peptide 1 in the pancreas. Pharmacol Ther. 2007;113:546–593. - PMC - PubMed
    1. Arnette D, Gibson TB, Lawrence MC, January B, Khoo S, et al. Regulation of ERK1 and ERK2 by glucose and peptide hormones in pancreatic beta cells. J Biol Chem. 2003;278:32517–32525. - PubMed
    1. Gomez E, Pritchard C, Herbert TP. cAMP-dependent protein kinase and Ca2+ influx through L-type voltage-gated calcium channels mediate Raf-independent activation of extracellular regulated kinase in response to glucagon-like peptide-1 in pancreatic beta-cells. J Biol Chem. 2002;277:48146–48151. - PubMed
    1. Benes C, Poitout V, Marie JC, Martin-Perez J, Roisin MP, et al. Mode of regulation of the extracellular signal-regulated kinases in the pancreatic beta-cell line MIN6 and their implication in the regulation of insulin gene transcription. Biochem J. 1999;340(Pt 1):219–225. - PMC - PubMed

Publication types

MeSH terms

Substances