. 2012 Jun;37(7):1749-63.
doi: 10.1038/npp.2012.22. Epub 2012 Mar 14.

Decreased cocaine motor sensitization and self-administration in mice overexpressing cannabinoid CB₂ receptors

Affiliations

Decreased cocaine motor sensitization and self-administration in mice overexpressing cannabinoid CB₂ receptors

Auxiliadora Aracil-Fernández et al. Neuropsychopharmacology. 2012 Jun.

Abstract

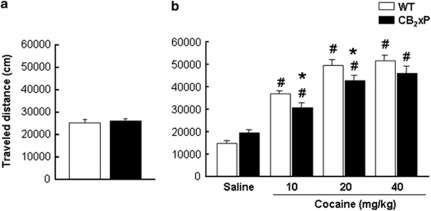
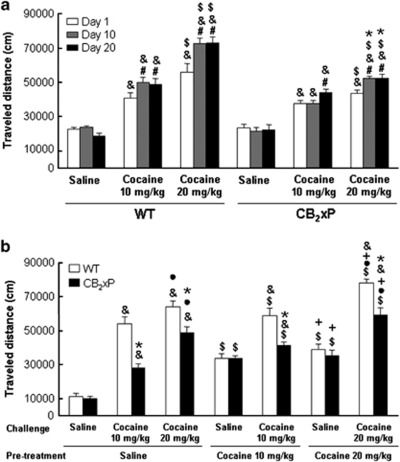
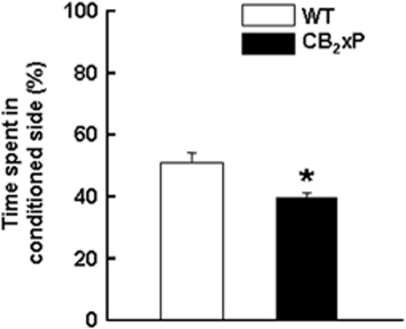
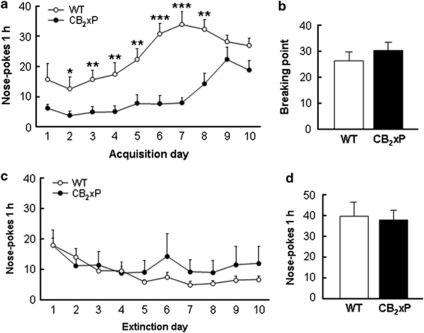
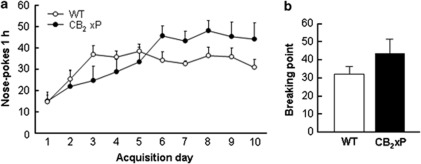
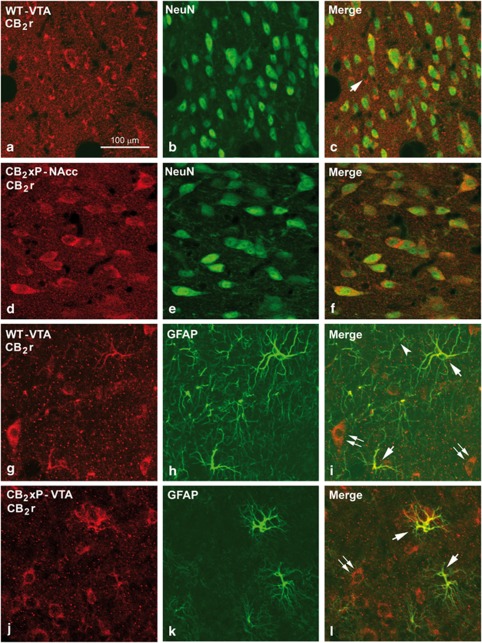
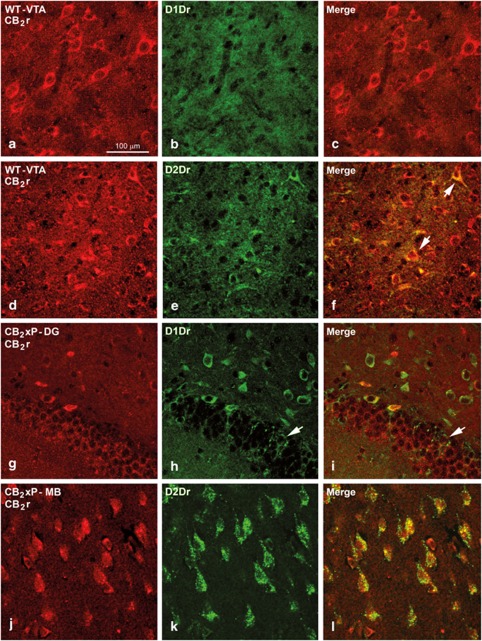
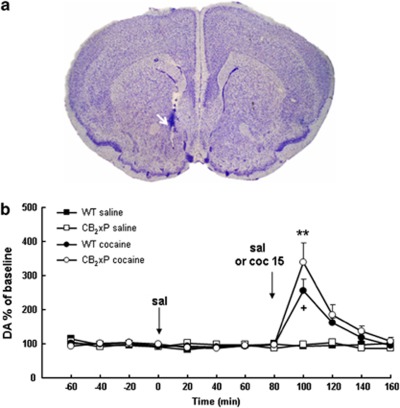
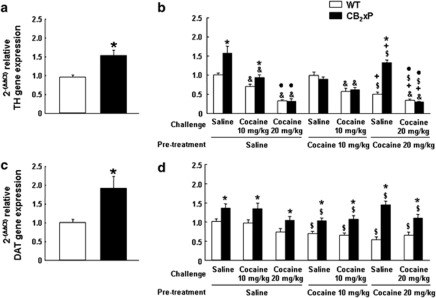
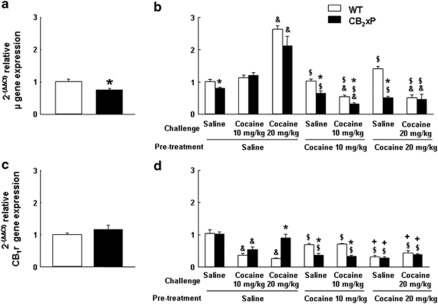
The potential involvement of the cannabinoid CB₂ receptors (CB₂r) in the adaptive responses induced by cocaine was studied in transgenic mice overexpressing the CB₂r (CB₂xP) and in wild-type (WT) littermates. For this purpose, the acute and sensitized locomotor responses to cocaine, conditioned place preference, and cocaine intravenous self-administration were evaluated. In addition, we assessed whether CB₂r were localized in neurons and/or astrocytes, and whether they colocalized with dopamine D1 and D2 receptors (D1Dr and D2Dr). Dopamine (DA) extracellular levels in the nucleus accumbens (NAcc), and gene expression of tyrosine hydroxylase (TH) and DA transporter (DAT) in the ventral tegmental area (VTA), and μ-opioid and cannabinoid CB₁ receptors in the NAcc were also studied in both genotypes. CB₂xP mice showed decreased motor response to acute administration of cocaine (10-20 mg/kg) and cocaine-induced motor sensitization compared with WT mice. CB₂xP mice presented cocaine-induced conditioned place aversion and self-administered less cocaine than WT mice. CB₂r were found in neurons and astrocytes and colocalized with D2Dr in the VTA and NAcc. No significant differences in extracellular DA levels in the NAcc were observed between genotypes after cocaine administration. Under baseline conditions, TH and DAT gene expression was higher and μ-opioid receptor gene expression was lower in CB₂xP than in WT mice. However, both genotypes showed similar changes in TH and μ-opioid receptor gene expression after cocaine challenge independently of the pretreatment received. Importantly, the cocaine challenge decreased DAT gene expression to a lesser extent in cocaine-pretreated CB₂xP than in cocaine-pretreated WT mice. These results revealed that CB₂r are involved in cocaine motor responses and cocaine self-administration, suggesting that this receptor could represent a promising target to develop novel treatments for cocaine addiction.


Figures

Figure 1
Figure 1
Motor activity in naïve animals and cocaine dose-response study in wild-type (WT) and CB2r overexpressing (CB2xP) mice. (a) Columns represent the means and vertical lines + SEM of traveled distance (cm) by WT (n=20) and CB2xP (n=20) mice under basal conditions. (b) Columns represent the means and vertical lines + SEM of traveled distance by WT and CB2xP mice (n=6 per group) in the open-field test during 20-min, 10-min after cocaine (10, 20, and 40 mg/kg) or saline administration. *P<0.05 vs WT mice receiving the same treatment. #P<0.05 vs saline-treated mice of similar genotype.
Figure 2
Figure 2
Sensitization to motor response induced by cocaine in wild-type (WT) and CB2r overexpressing (CB2xP) mice: Effect of challenge with cocaine after 6 days of withdrawal. Mice received a daily cocaine dose 10–20 mg/kg or saline, during 20 days. (a) Columns represent the means and vertical lines + SEM of traveled distance (cm) by mice, on day 1, 10, and 20 of cocaine or saline treatment. *P<0.001 vs WT mice, #P<0.001 vs day 1, &P<0.001 vs saline, and $P<0.001 vs cocaine (10 mg/kg). After 6 days of withdrawal from 20 days of cocaine (10 or 20 mg/kg) or saline pretreatment, both genotypes were challenged with a single dose of cocaine (10 or 20 mg/kg) or saline; (n=7 mice per group). (b) Columns represent the means and vertical lines + SEM of traveled distance (cm) by mice in the open-field test, after 10 min of cocaine or saline challenge. *P<0.001 vs WT mice, &P<0.001 vs saline challenge, P<0.001 vs cocaine challenge (10 mg/kg), $P<0.001 vs saline pre-treatment and, +P<0.001 vs cocaine pre-treatment (10 mg/kg).
Figure 3
Figure 3
Evaluation of conditioned place preference for cocaine in wild-type (WT) and CB2r overexpressing (CB2xP) mice. Columns represent the mean and vertical lines + SEM of time spent in the cocaine conditioned compartment by WT (n=8) and CB2xP (n=8) mice, expressed as percentage of total time. *P<0.05 vs WT mice.
Figure 4
Figure 4
Operant responding for cocaine in wild-type (WT) and CB2r overexpressing (CB2xP) mice. (a) Average number of nose-pokes + SEM in the active hole in WT (empty circles) and CB2xP (filled circles) mice in 1-h sessions during 10 days of training with cocaine (0.5 mg/kg/infusion); WT (n=8), CB2xP (n=10). (b) Breaking point achieved by WT (white bar) and CB2xP (black bar) mice under a progressive ratio schedule of reinforcement; WT (n=8), CB2xP (n=7). (c) Average number of nose-pokes + SEM during the initial 10 sessions of extinction in the active hole in both WT (empty circles) and CB2xP (filled circles) mice. (d) Responding in the active hole during cue-induced relapse of cocaine-seeking behavior tests in WT (white bar) and CB2xP (black bar) mice; WT (n=8), CB2xP (n=7). *P<0.05, **P<0.01, ***P<0.001, CB2xP mice vs WT mice.
Figure 5
Figure 5
Acquisition of operant responding for water in wild-type (WT) and CB2r overexpressing (CB2xP) mice. (a) Average number of nose-pokes + SEM in the active hole in both WT (empty circles) and CB2xP (filled circles) mice in 1-h sessions during 10 days of training with water under a fixed ratio 1 (FR1) schedule of reinforcement (10 μl of water in 10 s.); WT (n=7), CB2xP (n=8). (b) Breaking point achieved by WT (white bar) and CB2xP (black bar) mice under a progressive ratio schedule of reinforcement; WT (n=6), CB2xP (n=8).
Figure 6
Figure 6
Immunolabeling for CB2 receptors (CB2r) and neuronal nuclei (NeuN) in the ventral tegmental area (VTA) and the nucleus accumbens (NAcc) and for CB2r and glial fibrillary acidic protein (GFAP) in the VTA of wild-type (WT) and CB2r overexpressing (CB2xP) mice. Confocal photomicrographs showing immunolabeling for CB2r (red cells in (a) and (d)) and NeuN (green cells in (b) and (e)) in the VTA of WT and the NAcc of CB2xP mice. Double labeling (yellow cells in (c) and (f)) both in the VTA and the NAcc indicates that most of the CB2r immunoreactive (i.r.) cells are neurons. A CB2r cell not labeled for NeuN is shown in (c) (arrow). (g–l) Immunolabeling for CB2r (red cells in (g) and (j)) and GFAP (green cells in (h) and (k)) in the VTA of WT and CB2xP mice. Double labeling (yellow cells in (i) and (l)) shows that most of the GFAP i.r. astrocytes are also immunolabeled for CB2r (arrows in (i) and (l)). GFAP i.r. astrocytes not CB2r i.r. can be rarely seen (arrow head). CB2r immunolabeled cells, most probably neurons, are showed in (i) and (l) (double arrow). Same scale for (b–l).
Figure 7
Figure 7
Immunolabeling for CB2 receptors (CB2r), D1 and D2 dopamine receptors (D1Dr and D2Dr, respectively) in wild-type (WT) and CB2r overexpressing (CB2xP) mice. Confocal photomicrographs showing immunolabeling for CB2r (red cells in (a), (d), (g) and, (j)), and D1Dr and D2Dr (green cells in (b), (e), (h) and, (k)) in the ventral tegmental area (VTA) of WT mice (a–f), hippocampal dentate gyrus (DG; g–i) and mammillary bodies (MB; j–l) of CB2xP mice. Double labeling (yellow cells) is shown in (c), (f), (i), and (l). In the VTA and the NAcc no D1Dr immunoreactive (i.r.) cells were seen, but they were more numerous in other brain areas. Several D1Dr i.r. neurons in the granular layer (arrow) and hilus of the dentate gyrus of the hippocampus are shown; some of them are also CB2r i.r. (yellow labeling in (i)). Neurons double labeled for CB2r and D2Dr in the MB are shown (l). Note that most of the D2Dr i.r. are also labeled for CB2r. Same scale for (b–l).
Figure 8
Figure 8
Microdialysis data for wild-type (WT) and CB2r overexpressing (CB2xP) mice. (a) A coronal section of the brain of a representative mouse stained with cresyl violet (magnification: × 2.0) showing the position of the microdialysis probe in the NAcc. (b) Dopamine (DA) outflow in the NAcc (% of baseline+SEM) during 240 min before and after drug challenge (arrows) in four treatment groups: Group 1 (WT saline (sal)) and group 2 (CB2xP saline) received two injections of saline (one every 80 min), group 3 (WT cocaine (coc)) and group 4 (CB2xP cocaine) received a first injection of saline followed by a second injection of cocaine (15 mg/kg, i.p), and four dialysates (20 μl) were collected after each administration. **P<0.01 (CB2xP cocaine vs CB2xP saline), +P<0.05 (WT cocaine vs WT saline).
Figure 9
Figure 9
Changes in tyrosine hydroxylase (TH) and DA transporter (DAT) gene expression induced by cocaine in the ventral tegmental area (VTA) of CB2r overexpressing (CB2xP) and wild-type (WT) mice. (a, c) Columns represent the means and vertical lines + SEM of 2(−ΔΔCt) of relative TH and DAT gene expression, respectively, in WT (n=6) and CB2xP (n=6) mice measured in the VTA under baseline conditions. (b, d) WT and CB2xP mice (n=6 per group) received a challenge of saline or cocaine (10–20 mg/kg) after 6 days of withdrawal from 20 days of pre-treatment with saline or cocaine (10–20 mg/kg). Columns represent the means and vertical lines + SEM of 2(−ΔΔCt) of relative TH and DAT gene expression in WT and CB2xP mice challenged with saline or cocaine. *P<0.001 vs WT, &P<0.05 vs saline challenge, P<0.05 vs cocaine challenge (10 mg/kg), $P<0.05 vs saline pre-treatment and, +P<0.05 vs cocaine pre-treatment (10 mg/kg).
Figure 10
Figure 10
Changes in μ-opioid and CB1 receptor gene expression induced by cocaine in the nucleus accumbens (NAcc) of CB2r overexpressing (CB2xP) and wild-type (WT) mice. (a, c) Columns represent the means and vertical lines + SEM of 2(−ΔΔCt) of relative μ-opioid and CB1 receptor gene expression, respectively, in WT and CB2xP mice (n=6 per group) measured in the NAcc under baseline conditions. (b, d) WT and CB2xP mice (n=6 per group) received a challenge of saline or cocaine (10–20 mg/kg), after 6 days of withdrawal from 20 days of pre-treatment with saline or cocaine (10–20 mg/kg). Columns represent the means and vertical lines + SEM of 2(−ΔΔCt) of relative μ-opioid and CB1 receptor gene expression in WT and CB2xP mice challenged with saline or cocaine. *P<0.001 vs WT, &P<0.05 vs saline challenge, $P<0.05 vs saline pre-treatment and, +P<0.05 vs cocaine pre-treatment (10 mg/kg).

References

    1. Andre VM, Cepeda C, Cummings DM, Jocoy EL, Fisher YE, William Yang X, et al. Dopamine modulation of excitatory currents in the striatum is dictated by the expression of D1 or D2 receptors and modified by endocannabinoids. Eur J Neurosci. 2010;31:14–28. - PubMed
    1. Corbille AG, Valjent E, Marsicano G, Ledent C, Lutz B, Herve D, et al. Role of cannabinoid type 1 receptors in locomotor activity and striatal signaling in response to psychostimulants. J Neurosci. 2007;27:6937–6947. - PMC - PubMed
    1. Cossu G, Ledent C, Fattore L, Imperato A, Bohme GA, Parmentier M, et al. Cannabinoid CB1 receptor knockout mice fail to self-administer morphine but not other drugs of abuse. Behav Brain Res. 2001;118:61–65. - PubMed
    1. Chefer VI, Kieffer BL, Shippenberg TS. Contrasting effects of mu opioid receptor and delta opioid receptor deletion upon the behavioral and neurochemical effects of cocaine. Neuroscience. 2004;127:497–503. - PubMed
    1. De Vries TJ, Shaham Y, Homberg JR, Crombag H, Schuurman K, Dieben J, et al. A cannabinoid mechanism in relapse to cocaine seeking. Nat Med. 2001;7:1151–1154. - PubMed

Publication types

MeSH terms