

Diametrically opposite methylome-transcriptome relationships in high- and low-CpG promoter genes in postmitotic neural rat tissue
- PMID: 22415013
- PMCID: PMC3368807
- DOI: 10.4161/epi.19565
Diametrically opposite methylome-transcriptome relationships in high- and low-CpG promoter genes in postmitotic neural rat tissue
Abstract
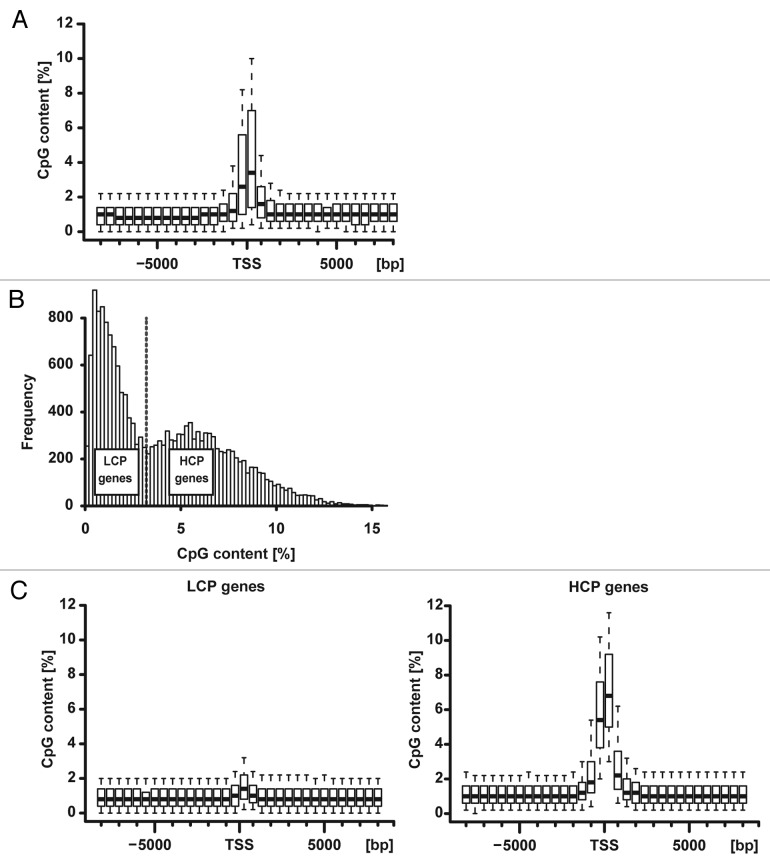
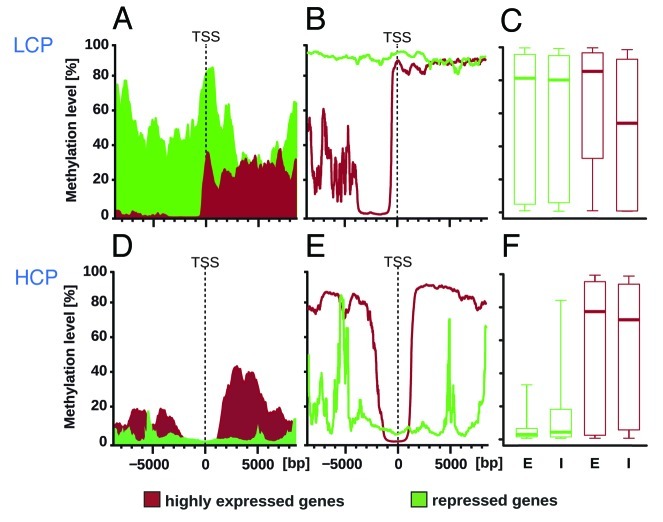
DNA methylation can control some CpG-poor genes but unbiased studies have not found a consistent genome-wide association with gene activity outside of CpG islands or shores possibly due to use of cell lines or limited bioinformatics analyses. We performed reduced representation bisulfite sequencing (RRBS) of rat dorsal root ganglia encompassing postmitotic primary sensory neurons (n = 5, r > 0.99; orthogonal validation p < 10(-19)). The rat genome suggested a dichotomy of genes previously reported in other mammals: low CpG content (< 3.2%) promoter (LCP) genes and high CpG content (≥ 3.2%) promoter (HCP) genes. A genome-wide integrated methylome-transcriptome analysis showed that LCP genes were markedly hypermethylated when repressed, and hypomethylated when active with a 40% difference in a broad region at the 5' of the transcription start site (p < 10(-87) for -6000 bp to -2000 bp, p < 10(-73) for -2000 bp to +2000 bp, no difference in gene body p = 0.42). HCP genes had minimal TSS-associated methylation regardless of transcription status, but gene body methylation appeared to be lost in repressed HCP genes. Therefore, diametrically opposite methylome-transcriptome associations characterize LCP and HCP genes in postmitotic neural tissue in vivo.
Figures
Similar articles
-
Plasticity of DNA methylation in a nerve injury model of pain.Epigenetics. 2015;10(3):200-12. doi: 10.1080/15592294.2015.1006493. Epigenetics. 2015. PMID: 25621511 Free PMC article.
-
DNA methylation profiling of CpG islands in trigeminal ganglion of rats with orofacial pain induced by experimental tooth movement.BMC Oral Health. 2024 Dec 4;24(1):1474. doi: 10.1186/s12903-024-05269-4. BMC Oral Health. 2024. PMID: 39633318 Free PMC article.
-
Simultaneous profiling of transcriptome and DNA methylome from a single cell.Genome Biol. 2016 May 5;17:88. doi: 10.1186/s13059-016-0950-z. Genome Biol. 2016. PMID: 27150361 Free PMC article.
-
Whole Genomic DNA Methylation Profiling of CpG Sites in Promoter Regions of Dorsal Root Ganglion in Diabetic Neuropathic Pain Mice.J Mol Neurosci. 2021 Dec;71(12):2558-2565. doi: 10.1007/s12031-021-01847-1. Epub 2021 May 5. J Mol Neurosci. 2021. PMID: 33950354
-
Smart-RRBS for single-cell methylome and transcriptome analysis.Nat Protoc. 2021 Aug;16(8):4004-4030. doi: 10.1038/s41596-021-00571-9. Epub 2021 Jul 9. Nat Protoc. 2021. PMID: 34244697 Free PMC article. Review.
Cited by
-
Plasticity of DNA methylation in a nerve injury model of pain.Epigenetics. 2015;10(3):200-12. doi: 10.1080/15592294.2015.1006493. Epigenetics. 2015. PMID: 25621511 Free PMC article.
-
DNA methylation of alternative promoters directs tissue specific expression of Epac2 isoforms.PLoS One. 2013 Jul 4;8(7):e67925. doi: 10.1371/journal.pone.0067925. Print 2013. PLoS One. 2013. PMID: 23861833 Free PMC article.
-
Myogenic differential methylation: diverse associations with chromatin structure.Biology (Basel). 2014 Jun 19;3(2):426-51. doi: 10.3390/biology3020426. Biology (Basel). 2014. PMID: 24949935 Free PMC article.
-
Genome-wide DNA methylation patterns and transcription analysis in sheep muscle.PLoS One. 2014 Jul 10;9(7):e101853. doi: 10.1371/journal.pone.0101853. eCollection 2014. PLoS One. 2014. PMID: 25010796 Free PMC article.
-
Comparative Epigenomic Profiling of the DNA Methylome in Mouse and Zebrafish Uncovers High Interspecies Divergence.Front Genet. 2016 Jun 17;7:110. doi: 10.3389/fgene.2016.00110. eCollection 2016. Front Genet. 2016. PMID: 27379160 Free PMC article.
References
Publication types
MeSH terms
Substances
Grants and funding
LinkOut - more resources
Full Text Sources
Miscellaneous