. 2012 May 2;31(9):2090-102.
doi: 10.1038/emboj.2012.60. Epub 2012 Mar 13.

A unique role of cohesin-SA1 in gene regulation and development

Affiliations

A unique role of cohesin-SA1 in gene regulation and development

Silvia Remeseiro et al. EMBO J. .

Abstract

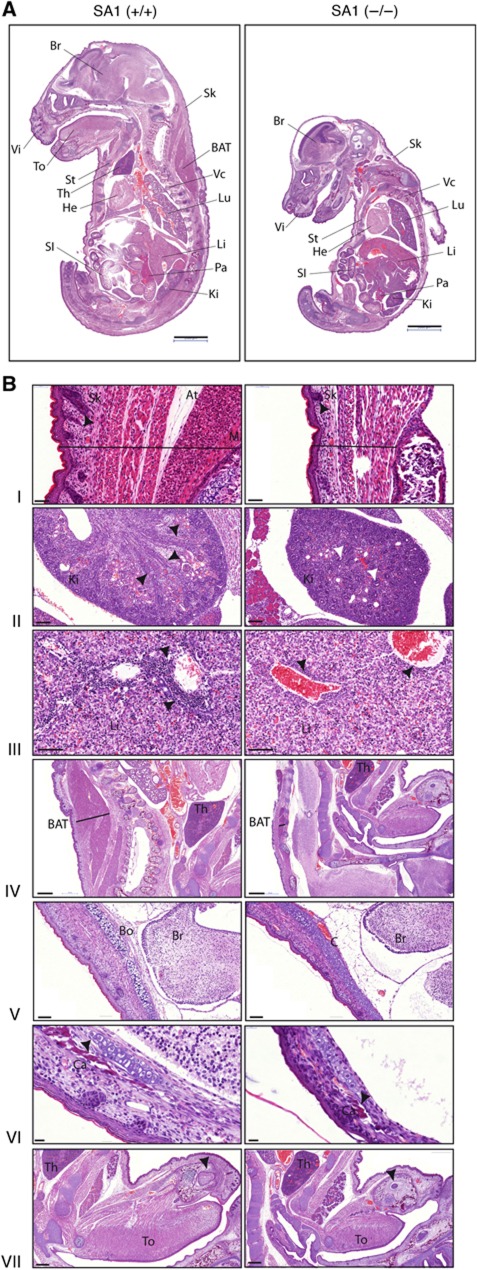
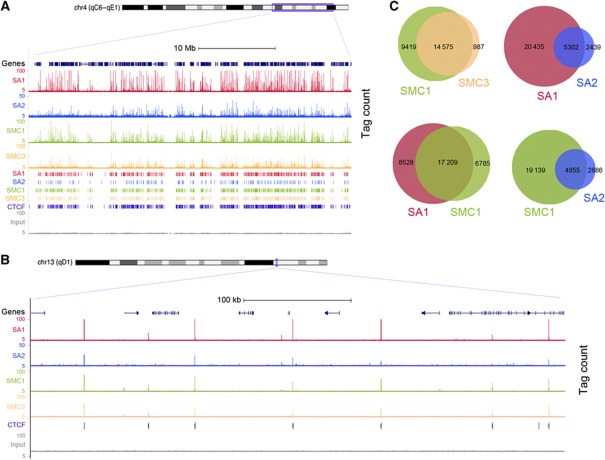
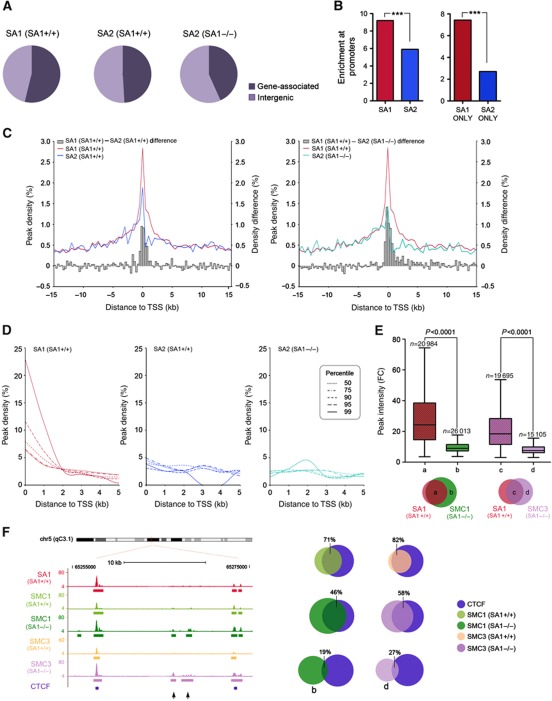
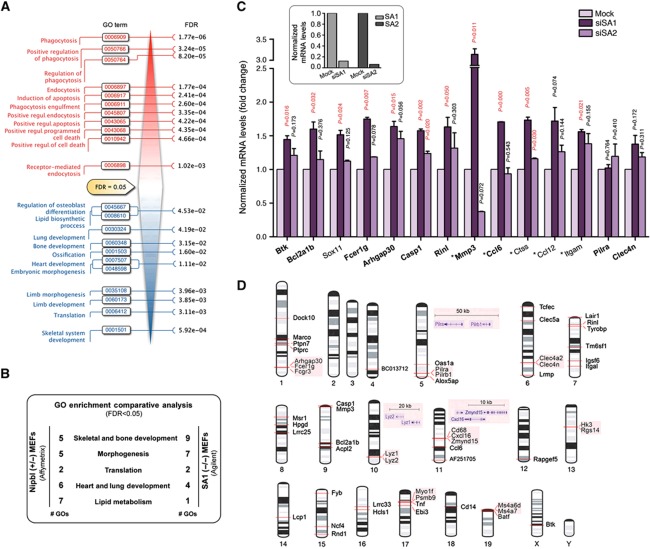
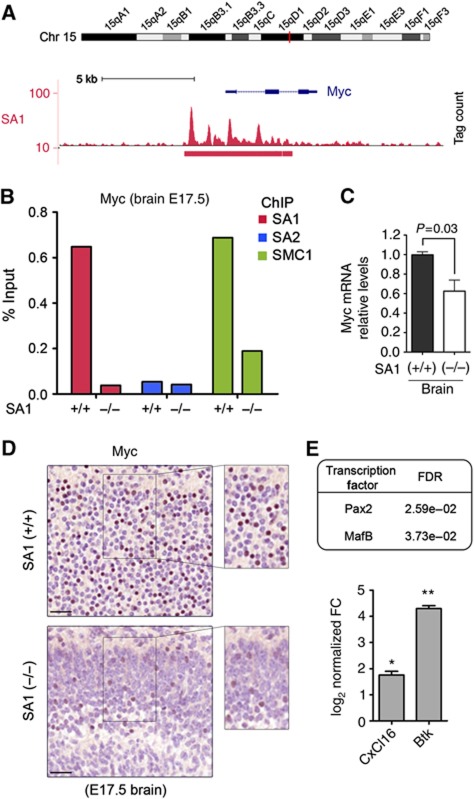
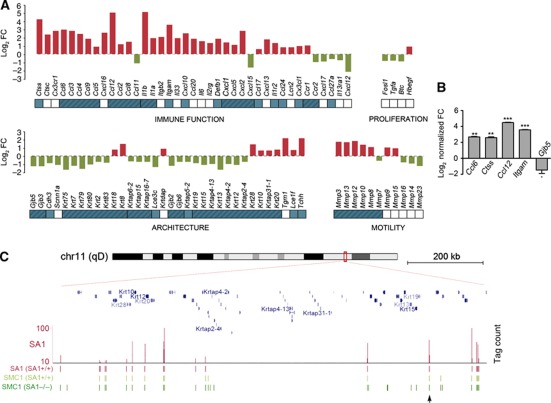
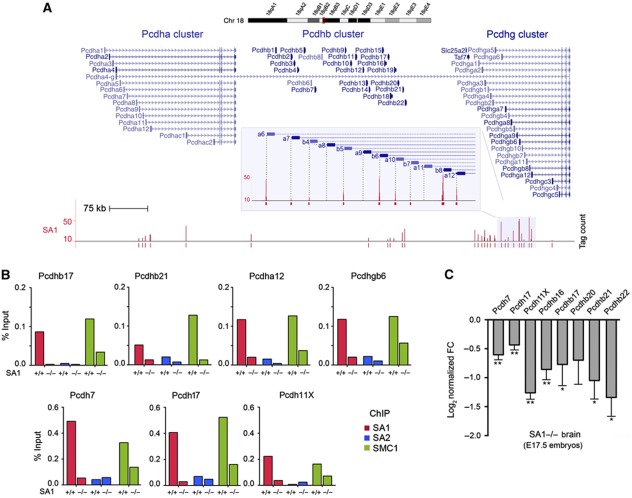
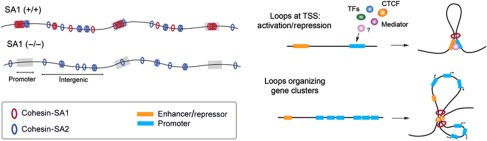
Vertebrates have two cohesin complexes that consist of Smc1, Smc3, Rad21/Scc1 and either SA1 or SA2, but their functional specificity is unclear. Mouse embryos lacking SA1 show developmental delay and die before birth. Comparison of the genome-wide distribution of cohesin in wild-type and SA1-null cells reveals that SA1 is largely responsible for cohesin accumulation at promoters and at sites bound by the insulator protein CTCF. As a consequence, ablation of SA1 alters transcription of genes involved in biological processes related to Cornelia de Lange syndrome (CdLS), a genetic disorder linked to dysfunction of cohesin. We show that the presence of cohesin-SA1 at the promoter of myc and of protocadherin genes positively regulates their expression, a task that cannot be assumed by cohesin-SA2. Lack of SA1 also alters cohesin-binding pattern along some gene clusters and leads to dysregulation of genes within. We hypothesize that impaired cohesin-SA1 function in gene expression underlies the molecular aetiology of CdLS.


Conflict of interest statement

The authors declare that they have no conflict of interest.

Figures

Figure 1
Figure 1
SA1-null embryos present growth delay. Histological analysis of HE-stained tissue sections from E17.5 embryos shows general hypoplasia and developmental delay in SA1-null embryos. (A) SA1-null embryos present a much reduced body size compared with their wild-type littermates. The following organs/tissues are indicated: BAT, brown adipose tissue; Br, brain; He, heart; Ki, kidney; Li, liver; Lu, lung; Pa, pancreas; SI, small intestine; Sk, skin; St, sternum; Th, thymus; To, tongue; Vc, vertebral column; Vi, vibrissa. Scale bars, 2 mm. (B) Detailed sections of different tissues showing either developmental delay or CdLS features. (I) Thinner skin (black line) in SA1-null embryos with less hair follicles (arrowheads), reduced adipose tissue (At) and thinner muscle layer (M). Scale bars, 50 μm. (II) Kidney sections showing collecting ducts already formed in wild-type (black arrowheads) and not radially arranged in SA1-null embryos. In the latter, glomeruli are dispersed all over as primitive glomeruli at earlier stages (white arrowheads). Scale bars, 100 μm. (III) Decreased number of haematopoietic precursors in livers from SA1-null embryos compared with wild-type (arrowheads). Scale bars, 100 μm. (IV) Thickness of the interscapular layer of BAT is dramatically diminished in SA1-null embryos (black line). Scale bars, 500 μm. (V) Delayed intramembranous ossification in the cranium in the absence of SA1. Notice the presence of cartilage (C) in SA1-null embryos instead of bone (Bo) already formed in the wild-type. Scale bars, 100 μm. (VI) Defective bone calcification (Ca) in the cranium from SA1-null embryos. Scale bars, 20 μm. (VII) Delay in dentition in SA1-null embryos. Arrowheads in both sections indicate tooth buds. Scale bars, 500 μm.
Figure 2
Figure 2
Genome-wide distribution of cohesin-SA1 and cohesin-SA2 in the mouse genome. (A) Representative genomic distribution of SA1, SA2, SMC1 and SMC3 in a region of mouse chromosome 4. Tag counts (upper) and called peak tracks (lower) are shown. A track with CTCF-binding sites (from ENCODE/Stanford/Yale data set) and the input are also depicted. Higher magnification of a region of chromosome 13 is shown in (B). (C) Venn diagrams showing the overlapping between the binding sites identified in wild-type MEFs by ChIP-seq with the indicated antibodies.
Figure 3
Figure 3
Cohesin distribution depends on SA1. (A) Distribution of SA1 and SA2 in SA1+/+ (wild-type) cells and of SA2 in SA1−/− cells represented as percentage of peaks detected at gene-associated regions (including 1 kb upstream TSS, Gene Body and 1 kb downstream TTS) and intergenic regions. Notice that SA2 relocates towards intergenic regions in the absence of SA1. (B) Left: The percentage of SA1 and SA2 binding sites located in regions 1 kb upstream TSS in wild-type cells was normalized against the frequency of these regions in the genome and displayed as fold enrichment. Right: Same analysis performed for positions that are exclusive for SA1 or SA2 (shadowed bars). ***P<0.0001. (C) Cohesin distribution around TSS (±15 kb) defined as peak density (%). The histogram represents the difference in peak density between SA1 and SA2. (D) Frequency of binding at TSS in percentiles of peak length distribution (P50, P75, P90, P95 and P99). (E) Peak intensity (measured as fold change) for SMC1 and SMC3 peaks identified in SA1-null MEFs that overlap (groups ‘a’ and ‘c’) or not (groups ‘b’ and ‘d’) with SA1 peaks, as indicated in the Venn diagrams below the graph. Notice that cohesin positions in groups ‘a’ and ‘c’ present significantly higher occupancy (medians=24.4 and 18.5, respectively) than those in groups ‘b’ and ‘d’ (medians=9.2 and 7.6, respectively). See Supplementary Figure S3B for the number of peaks in each group. (F) Left: Representative image showing the redistribution of SMC1 and SMC3 in SA1-null cells towards low occupancy sites (arrowheads). Right: Venn diagrams showing the overlapping between CTCF-binding sites and the cohesin-binding sites indicated, including those defined as groups ‘b’ and ‘d’ in (E). More detailed information regarding the peak number within each group is shown in Supplementary Figure S3A and B.
Figure 4
Figure 4
Gene expression changes in the absence of SA1. (A) GO analysis (FDR<0.05) reveals biological processes upregulated (in red) and downregulated (in blue) in SA1-null MEFs compared with wild-type. FDRs for each of the enriched GO terms are indicated. (B) GO Comparative Analysis (FDR<0.05) between transcriptomes from SA1-null and Nipbl-heterozygous MEFs. Common GO terms were grouped in five big biological processes: skeletal and bone development, morphogenesis, translation, heart and lung development and lipid metabolism. The number of GO terms belonging to each group is shown (# GOs). (C) Expression of a set of SA1-regulated genes that includes 10 DEGs (shown in bold) and additional genes (Sox11 and skin-related genes, marked with an asterisk) was measured in wild-type MEFs after transfection with SA1 or SA2 siRNAs (results come from triplicate qPCR reactions from two independent experiments). The upper inset shows the efficiency of siRNAs. (D) Chromosomal location of the 55 DEGs (FDR<0.15). Notice that 18 of them are located in close proximity (shadowed).
Figure 5
Figure 5
Cohesin-SA1 regulates myc expression. (A) SA1-binding region at myc gene (5350 bp) is the widest in the mouse genome (the median is 531 bp). (B) Validation by ChIP-qPCR of SA1, SA2 and SMC1 binding at myc promoter in wild-type (n=12) and SA1-null (n=9) E17.5 brains. (C) Myc mRNA levels are significantly reduced in SA1-null brains from E17.5 embryos. Three embryonic brains per genotype were used. (D) Immunohistochemistry on E17.5 brains showing reduced Myc protein levels in the cortex of SA1-null embryos. Notice the different cortical structure between wild-type and SA1-null brains. Scale bars, 40 μm. (E) Table showing two TFs whose target genes are dysregulated in SA1-null cells. Expression levels of two of those target genes (CxCl16 and Btk) were estimated from three independent qPCR reactions of two clones per genotype. Values are represented as log2 of fold change (FC) versus wild-type. **P<0.01, *P<0.05.
Figure 6
Figure 6
SA1 regulates clustered genes involved in skin development. (A) Transcriptional changes detected in genes involved in skin development and function in SA1-null cells. Bars represent the log2 FC in SA1-null compared with wild-type cells obtained from microarray analysis. Genes in clusters are depicted in blue and genes belonging to the same cluster are grouped (blue shadow). (B) Validation by RT–qPCR of transcriptional changes in some of the genes shown in (A) (from three independent qPCR reactions of two clones per genotype). ***P<0.001, **P<0.01, *P<0.05. (C) Detail of SA1 (SA1+/+), SMC1 (SA1+/+) and SMC1 (SA1−/−) binding sites at the Keratin cluster located on chromosome 11. Arrowhead points to a cohesin-SA1-binding site that is validated by ChIP-qPCR in Supplementary Figure S2C.
Figure 7
Figure 7
SA1 regulates the expression of protocadherins in mouse brain. (A) Detail of SA1-binding sites at Pcdh clusters located in chromosome 18. Notice the position of SA1 at multiple TSS. (B) SA1, SA2 and SMC1 binding at the TSS of four clustered and three non-clustered Pcdh genes was validated in vivo in wild-type (n=12) and SA1-null (n=9) E17.5 brains. (C) Significant downregulation of Pcdh genes in the brains from E17.5 SA1-null embryos (three embryos per genotype and three independent qPCR reactions per condition). Values are represented as log2 of FC versus wild-type. **P<0.01, *P<0.05, Pcdhb20 P-value=0.13.
Figure 8
Figure 8
A model for the differential distribution of cohesin-SA1 and cohesin-SA2 and its implications in transcription. Left: Different dynamics and localization of cohesin-SA1 and cohesin-SA2. Cohesin-SA1 is enriched at gene promoters to a much larger extent than cohesin-SA2. In SA1-null cells, cohesin-SA2 fails to accumulate at gene promoters and relocates to intergenic positions. Right: Proposed mechanisms for cohesin-SA1 in regulation of gene expression. Cohesin-SA1 present at gene promoters (upper panel) or in the proximity of genes organized in clusters (lower panel) is required for the formation of loops that arrange the chromatin for gene transcription. The insulator protein CTCF as well as different TFs are likely involved in cohesin-SA1 recruitment to specific genomic positions.

Comment in

References

    1. Bose T, Gerton JL (2010) Cohesinopathies, gene expression, and chromatin organization. J Cell Biol 189: 201–210 - PMC - PubMed
    1. Canudas S, Smith S (2009) Differential regulation of telomere and centromere cohesion by the Scc3 homologues SA1 and SA2, respectively, in human cells. J Cell Biol 187: 165–173 - PMC - PubMed
    1. Castronovo P, Gervasini C, Cereda A, Masciadri M, Milani D, Russo S, Selicorni A, Larizza L (2009) Premature chromatid separation is not a useful diagnostic marker for Cornelia de Lange syndrome. Chromosome Res 17: 763–771 - PubMed
    1. Chen X, Xu H, Yuan P, Fang F, Huss M, Vega VB, Wong E, Orlov YL, Zhang W, Jiang J, Loh YH, Yeo HC, Yeo ZX, Narang V, Govindarajan KR, Leong B, Shahab A, Ruan Y, Bourque G, Sung WK et al. (2008) Integration of external signaling pathways with the core transcriptional network in embryonic stem cells. Cell 133: 1106–1117 - PubMed
    1. Chien R, Zeng W, Kawauchi S, Bender MA, Santos R, Gregson HC, Schmiesing JA, Newkirk DA, Kong X, Ball AR Jr, Calof AL, Lander AD, Groudine MT, Yokomori K (2011) Cohesin mediates chromatin interactions that regulate mammalian beta-globin expression. J Biol Chem 286: 17870–17878 - PMC - PubMed

Publication types

MeSH terms