. 2012 May;22(5):925-38.
doi: 10.1101/gr.129692.111. Epub 2012 Mar 13.

Transcriptional variation in the malaria parasite Plasmodium falciparum

Affiliations

Transcriptional variation in the malaria parasite Plasmodium falciparum

Núria Rovira-Graells et al. Genome Res. 2012 May.

Abstract

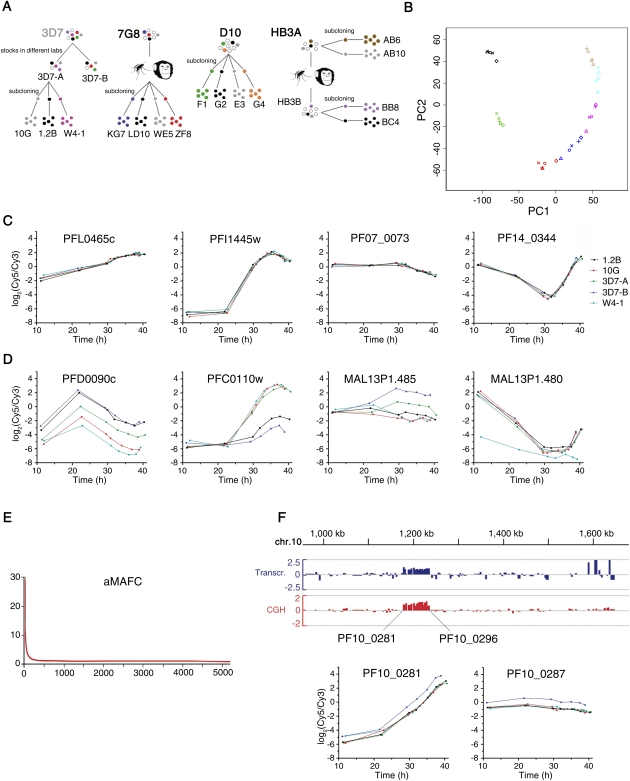
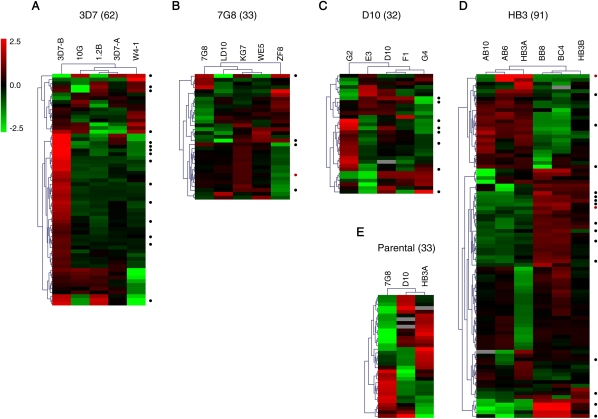
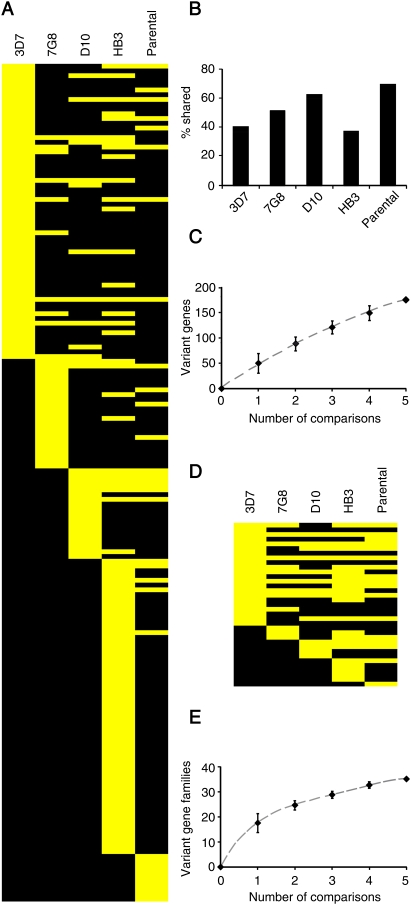
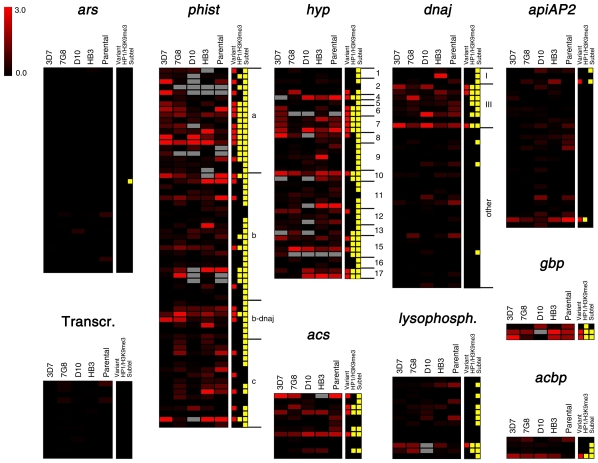
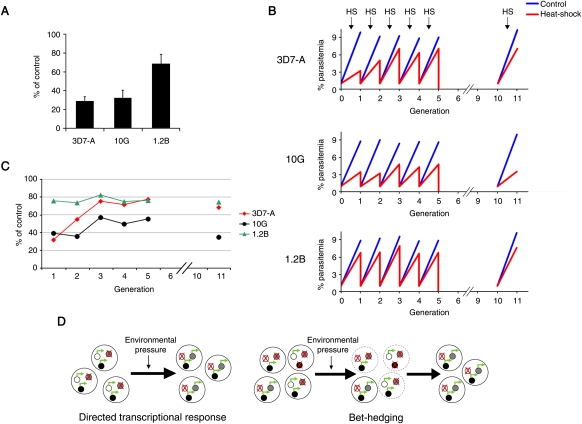
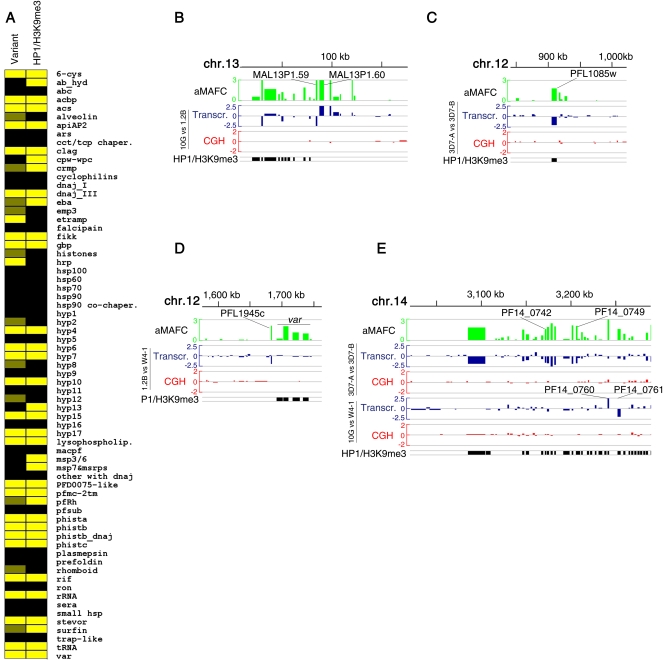
Malaria genetic variation has been extensively characterized, but the level of epigenetic plasticity remains largely unexplored. Here we provide a comprehensive characterization of transcriptional variation in the most lethal malaria parasite, Plasmodium falciparum, based on highly accurate transcriptional analysis of isogenic parasite lines grown under homogeneous conditions. This analysis revealed extensive transcriptional heterogeneity within genetically homogeneous clonal parasite populations. We show that clonally variant expression controlled at the epigenetic level is an intrinsic property of specific genes and gene families, the majority of which participate in host-parasite interactions. Intrinsic transcriptional variability is not restricted to genes involved in immune evasion, but also affects genes linked to lipid metabolism, protein folding, erythrocyte remodeling, or transcriptional regulation, among others, indicating that epigenetic variation results in both antigenic and functional variation. We observed a general association between heterochromatin marks and clonally variant expression, extending previous observations for specific genes to essentially all variantly expressed gene families. These results suggest that phenotypic variation of functionally unrelated P. falciparum gene families is mediated by a common mechanism based on reversible formation of H3K9me3-based heterochromatin. In changing environments, diversity confers fitness to a population. Our results support the idea that P. falciparum uses a bet-hedging strategy, as an alternative to directed transcriptional responses, to adapt to common fluctuations in its environment. Consistent with this idea, we found that transcriptionally different isogenic parasite lines markedly differed in their survival to heat-shock mimicking febrile episodes and adapted to periodic heat-shock with a pattern consistent with natural selection of pre-existing parasites.


Figures

Figure 1.
Figure 1.
Identification of genes under clonally variant expression. (A) Parasite lines used in this study. Parental parasite lines 3D7, 7G8, D10, and HB3A are of clonal origin. 3D7-A and 3D7-B are stocks of 3D7 maintained in different laboratories for some years (Cortés et al. 2004). 7G8 subclones were identified as self-fertilization events after passage through mosquito and splectomized chimpanzee (Hayton et al. 2008). HB3B was derived from self-crossing HB3A (Walliker et al. 1987). Parentals comparison included the three parental parasite lines shown in bold (7G8, D10, and HB3A). (B) Principal component analysis (PCA) of the time-course transcriptional analysis of 3D7 parasite lines. Samples from the same parasite line are represented by the same symbol, whereas samples collected at the same time point are represented by the same color. (C) Time-course expression plots of representative genes not showing clonally variant expression. Expression levels (log2 ratio of expression relative to the reference pool) are plotted against statistically estimated culture age (in hours post-invasion). The first gene has the median aMAFC, whereas the other three genes are single-copy genes commonly used as controls (rhopH2, seryl tRNA synthetase, and ptex150, in this order). (D) Time-course expression plots, as in C, but for genes showing clonally variant expression. The genes belong to the phista, clag, acs, and hrp families, in this order. (E) Distribution of aMAFC. Genes (x-axis) are ranked by their aMAFC in descending order. (F) Duplication of a region of chromosome 10 in 3D7-B. Transcript (blue) and gDNA (red) levels in 3D7-B relative to 3D7-A (log2 ratio) are shown for the second half of chromosome 10. The names of the first and last genes duplicated in 3D7-B are shown. Time-course expression plots for two of the genes within the duplication are shown.
Figure 2.
Figure 2.
Overview of genes showing transcriptional variability. Expression patterns are shown for the clonally variant genes identified in the 3D7 (A), 7G8 (B), D10 (C), HB3 (D), and parental lines (E) comparisons. The numbers in parenthesis indicate the number of variant genes in each comparison. Genes from the var, rif, stevor, and pfmc-2tm families are not included in the 3D7 heatmap, to make it comparable with the other parasite lines. Values are the log2 of the expression fold-change relative to the average expression in the parasite lines within each comparison. (Black dots) Genes showing the same transcriptional patterns in qPCR analysis of independent biological preparations; (red dots) genes that showed different patterns (Supplemental Fig. S8; Supplemental Table S3).
Figure 3.
Figure 3.
Overlap in the variantly expressed genes identified in the different comparisons. (A) Genes (in rows) that showed variant expression in the 3D7, 7G8, D10, HB3, or parental comparisons are shown in yellow in the corresponding lane. Genes from the var, rif, stevor, and pfmc-2tm families were excluded from this analysis, because they were only analyzed in the 3D7 comparison. (B) Percentage of variant genes identified in each comparison that showed variant expression in at least one other comparison. (C) Cumulative number of variantly expressed genes identified with increasing number of comparisons. Values are the average, with 95% ci, of all possible combinations of comparisons. (D,E) Same as panels A and C, but at the gene family level. Gene families are defined in Supplemental Table S4.
Figure 4.
Figure 4.
Distribution of variant expression in P. falciparum gene families. The log2 of the aMAFC for each comparison is shown for the genes of selected families. Aminoacyl-tRNA-synthetases (ars) and genes encoding the basal transcription machinery (Transcr.) (Bischoff and Vaquero 2010) provide appropriate controls as gene sets encoding essential genes, for which variant expression is not expected. For phist, hyp, and dnaj families, the specific family identity is indicated at the right of the heatmaps. Gene families are detailed in Supplemental Table S4. The tracks at the right indicate whether a gene was included in the list of variant genes (Supplemental Table S2), whether it was positive for heterochromatin marks HP1 or H3K9me3 in any of the published reports (Flueck et al. 2009; Lopez-Rubio et al. 2009; Salcedo-Amaya et al. 2009), and whether it is subtelomerically located (<150 kb from a chromosome end). Genes that show high aMAFC in some of the tracks but are not in the list of variant genes were excluded because changes in expression were attributable to CNVs, or for other reasons detailed in the text.
Figure 5.
Figure 5.
Adaptation to heat-shock. (A) Inhibition of parasite growth by a 3-h heat-shock at 41.5°C. Values are the average of three independent experiments, with standard deviation, and represent percentage of growth relative to identical cultures not subjected to heat-shock. Heat-shock was performed when parasites were at the trophozoite stage, and parasitemia was measured by FACS at the next generation. (B) Growth under periodic heat-shock. Parasites at the trophozoite stage were subjected to heat-shock for five consecutive generations. After each cycle, heat-shocked cultures were synchronized, adjusted to 1% parasitemia, and split into two identical dishes to compare again growth between heat-shock and control conditions. Cultures were grown without heat-shock in cycles 6–10. For details, see Supplemental Methods. (C) Percentage of growth under heat-shock relative to normal conditions, calculated from the data in panel B. (D) Schematic model for adaptation through directed transcriptional responses and adaptation through spontaneous clonally variant gene expression (bet-hedging). (Small circles) Individual genes that can be either repressed (crossed) or active (green arrow). In the directed transcriptional response scenario, a change in the environment results in an immediate protective transcriptional response, such that the external change is sensed, and specific genes are activated or repressed to mediate adaptation to the new conditions. In contrast, in the bet-hedging scenario, the population is transcriptionally heterogeneous as a consequence of spontaneous clonally variant gene expression. Upon a change in the environment, pre-existing parasites with combinations of expressed and repressed genes that confer fitness under the new conditions are selected and survive, whereas other parasites die (broken line).
Figure 6.
Figure 6.
Heterochromatin-based regulation of variant expression. (A) Correlation between variant expression and heterochromatin marks at the gene family level. (Yellow) Gene families (described in Supplemental Table S4) with at least one member showing variant expression (“Variant” column) or positive for heterochromatin marks (“HP1/H3K9me3” column) in any of the published studies (Flueck et al. 2009; Lopez-Rubio et al. 2009; Salcedo-Amaya et al. 2009). (Dark yellow) Gene families with only one gene showing variant expression in only one of the comparisons (gene families not included in Table 1). (B–E) Chromosomal distribution of variantly expressed genes. (Top lane, green) The log2 of the aMAFC in the 3D7 comparison. The other lanes represent the relative transcript (blue) and gDNA (red) levels in pairwise parasite line comparisons, expressed as the log2 ratio of the fold-change. (Bottom lane, black) HP1- or H3K9me3-positive genes.

Comment in

References

    1. Anders RF, Brown GV, Edwards A 1983. Characterization of an S antigen synthesized by several isolates of Plasmodium falciparum. Proc Natl Acad Sci 80: 6652–6656 - PMC - PubMed
    1. Balaji S, Babu MM, Iyer LM, Aravind L 2005. Discovery of the principal specific transcription factors of Apicomplexa and their implication for the evolution of the AP2-integrase DNA binding domains. Nucleic Acids Res 33: 3994–4006 - PMC - PubMed
    1. Benjamini Y, Hochberg Y 1995. Controlling the false discovery rate: A practical and powerful approach to multiple testing. J R Statist Soc 57: 289–300
    1. Bethke LL, Zilversmit M, Nielsen K, Daily J, Volkman SK, Ndiaye D, Lozovsky ER, Hartl DL, Wirth DF 2006. Duplication, gene conversion, and genetic diversity in the species-specific acyl-CoA synthetase gene family of Plasmodium falciparum. Mol Biochem Parasitol 150: 10–24 - PubMed
    1. Bischoff E, Vaquero C 2010. In silico and biological survey of transcription-associated proteins implicated in the transcriptional machinery during the erythrocytic development of Plasmodium falciparum. BMC Genomics 11: 34 doi: 10.1186/1471-2164-11-34 - PMC - PubMed

Publication types

MeSH terms

Substances