Review
. 2012 May;34(5):377-85.
doi: 10.1002/bies.201100118. Epub 2012 Mar 13.

Scanning image correlation spectroscopy

Affiliations
Review

Scanning image correlation spectroscopy

Michelle A Digman et al. Bioessays. 2012 May.

Abstract

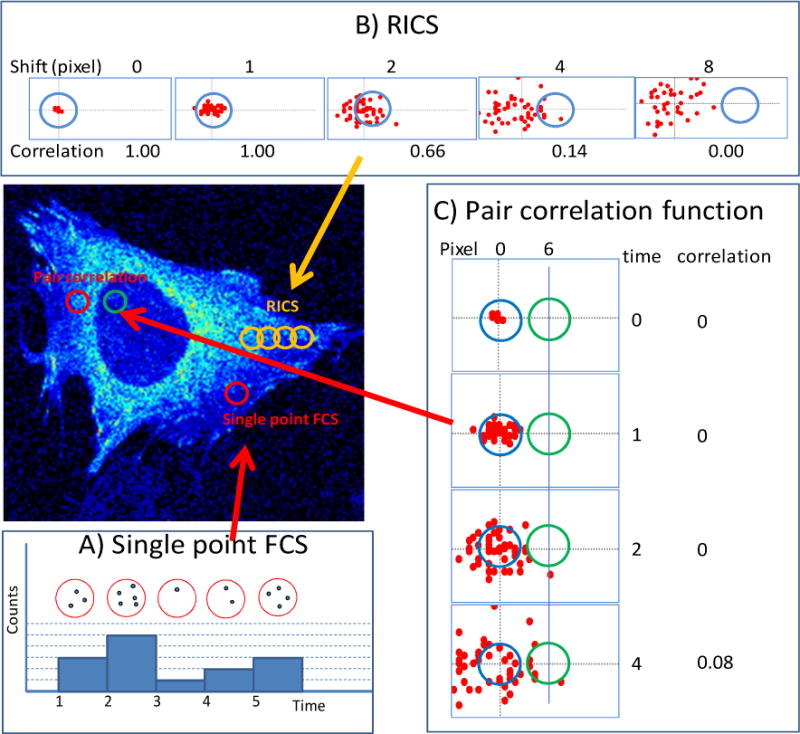
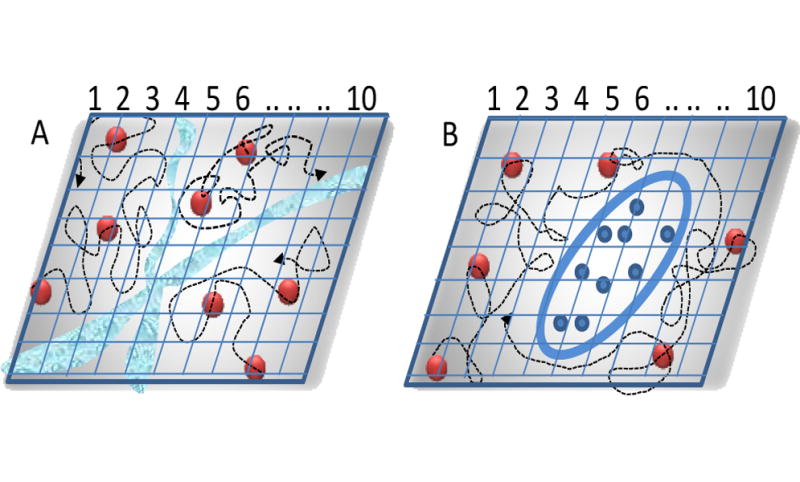
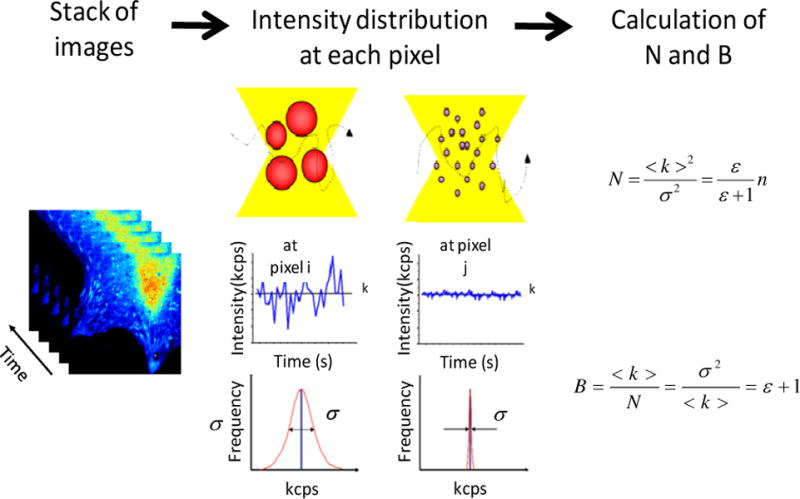
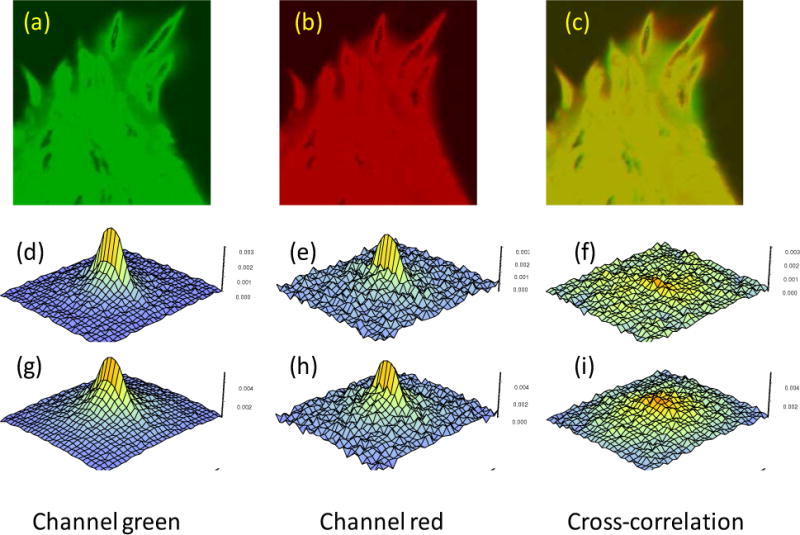
Molecular interactions are at the origin of life. How molecules get at different locations in the cell and how they locate their partners is a major and partially unresolved question in biology that is paramount to signaling. Spatio-temporal correlations of fluctuating fluorescently tagged molecules reveal how they move, interact, and bind in the different cellular compartments. Methods based on fluctuations represent a remarkable technical advancement in biological imaging. Here we discuss image analysis methods based on spatial and temporal correlation of fluctuations, raster image correlation spectroscopy, number and brightness, and spatial cross-correlations that give us information about how individual molecules move in cells and interact with partners at the single molecule level. These methods can be implemented with a standard laser scanning microscope and produce a cellular level spatio-temporal map of molecular interactions.


Figures

Figure 1
Figure 1
Schematic illustration of fluorescence fluctuation experiments. In the figure a volume of illumination (PSF) is shown as a colored circle. In reality, a PSF represents a diffraction limited spot the size of 200–300nm and it extends in 3D. The sampling time per pixel is generally on the order of 1 to 10us . (A) Single point FCS. A single point in the cell is illuminated with a diffraction limited spot. The fluorescence intensity is recorded at the same position as a function of time using a fast detector. The fluorescence fluctuations are correlated using the mathematics of the correlation functions. Only the same molecule entering and leaving the volume of illumination will give a correlated (in time) fluctuation and contribute to the correlation function. The motion of many molecules is not correlate each other so that the overall contribution to the correlation function will be null (B) RICS. In the confocal microscope the intensity is collected in sequence of neighbor pixels. As the molecules move and the pixel position is changed, only these molecules that can move fast enough will be observed at a distant pixel of the same image frame. In the figure, the red dots represent molecules diffusing in a plane. As a function of time, molecules spread from the initial position. The RICS correlation function is proportional to the product of the number of molecules in the pixel sequence. For example, if 50 molecules were at the center of the original pixel at time zero, as the scanner moves the excitation volume by a small quantity we still get approximately 50 molecules at the next pixel. However, as the raster scan proceeds, fewer molecules that were at the original pixel position can be found in position 4 or 8 in the figure. Remember that only the same molecule give a net positive correlation. (C) Pair correlation function. The fluctuations at two distant pixels (6 pixels apart in the schematic figure indicated in red and in blue) are measured and the correlation function of the fluctuations is calculated at these two pixels at different delay times. At very short delay time, molecules that were originally in the red pixel, cannot reach the blue pixel. As the time proceeds, a molecule originally at the red pixel can reach the blue pixel, producing a net positive delayed correlation as illustrated in the figure for the time delay of 4. Clearly, if the two pixels are at the same location, the pair correlation function is the same thing as the single point FCS.
Figure 2
Figure 2
Schematic representation of the pair correlation approach. A) The correlations at two distinct points are cross correlated. If there is a diffusion barrier like in A) points in the region indicated by 1,2 and 3 cannot correlate with points in the region indicated by 5, 6. B) if there is an obstacle, particles can go around. Cross-correlation is possible at all location (except in the obstacle) but there will be a time delay in the correlation due to the longer path the molecules have to take to go around the obstacle.
Figure 3
Figure 3
Starting with an image stack, we calculate the average intensity and the variance σ2 at each pixel. The Number of particles N is defined as the ratio of the square of the average intensity to the variance and it can be expressed in terms of the molecular brightness ɛ and number of molecules n. The Brightness B is defined as the ratio of the variance to the average intensity. B is related to the molecular brightness ɛ. Per equal average intensity, the variance depends on the number of particles and the brightness of each particle.
Figure 4
Figure 4
Panel a), b) and c) show intensity images of a cell expressing FAK-EGFP and paxillin-mCherry in the green and red channels and the RGB composition of the green and red channels. The size of the image is 20.5 μm square (or 0.08 μm/pixel) Panels d), e) and f) are the RICS auto (channel 1 and 2) and cross correlation signal using a moving average of 10 s to remove the quasi-immobile components. The correlation function is calculated using a region of 32 pixels (2.56μm). Panels g), h) and i) are the RICS functions obtained using a moving average of 40 s. Images obtained with an Olympus FV1000 microscope. The instrument setup is described in [6].
Figure 5
Figure 5
Time evolution of COS-7 cell transfected with Httex1p-97QP-EGFP. Cells were imaged with 0.8% laser power at 488nm and 20μs/pixel. The different rows correspond to the different phases of the aggregation process. The first column shows the average intensity image. The color scale is shown for the first image. In the last image, the white color corresponds to detector saturation. The molecular brightness first increases and then decreases after the formation of the inclusions (indicated by red arrows). The green arrows indicate the points of nucleation. The selection of pixels with the brightness of the monomers (B=1.074, ɛ=3700 cpsm) and oligomers (B=1.74, ɛ=37000 cpsm) are reported in the second and third columns. In the fourth column the fraction of pixels corresponding to monomer (green) and oligomers (yellow) are reported. This graph has been obtained from the analysis of different cells at the different phases shown. The number of pixels with brightness corresponding to oligomers composed of about 2 monomers increases until the inclusion is formed and recruits the majority of the protein.
Figure 6
Figure 6. Overview of the line measurement
(A) Free EGFP in CHOK1 cell. Scale bar: 5μm. (B) Nucleus of CHOK1 cell stained with Hoechst 33342. (C) Merged image of A and B. (D) Free EGFP in the plane of the line drawn: 3.3μm (E) Hoechst 33342 staining in the plane of the line drawn: 3.3μm. (F) Merged image of D and E. (G) Schematic of the laser PSF traversing across a 3.2μm line (32 pixels) in the nucleus, scanning from left to right with a pixel dwell time of 6.3μs and a line time of 0.47ms. (H) Comparison of the intensity profile of EGFP and Hoechst 33342 for a line experiment.
Figure 7
Figure 7. pCF carpet analysis of intranuclear diffusion
(A)–(B) Intensity profile of the Hoechst 33342 stain across the line measured. (E) pCF(0) carpet which corresponds to calculation of an ACF carpet. (F) pCF(1) carpet which corresponds to cross correlation of adjacent pixels in the same DNA environment within the PSF. (G) pCF(8) carpet which corresponds to cross correlation of pixels in different density DNA environments. (H) pCF(14) carpet which corresponds to cross correlation of pixels in low-low DNA around a high DNA density environment or pixels in high-high DNA around a low DNA density environment. (I) Fitting of an extracted column from each of the pCF carpets (0, 1, 8 and 14) corresponding to low DNA (col. 4). (J) Fitting of an extracted column from each of the pCF carpets (0, 1, 8 and 14) corresponding to high DNA (col. 13).

References

    1. Poo M, Cone RA. Lateral diffusion of rhodopsin in the photoreceptor membrane. Nature. 1974;247:438–41. - PubMed
    1. Axelrod D, Koppel DE, Schlessinger J, Elson E, Webb WW. Mobility measurement by analysis of fluorescence photobleaching recovery kinetics. Biophys J. 1976;16:1055–69. - PMC - PubMed
    1. Saxton MJ, Jacobson K. Single-particle tracking: applications to membrane dynamics. Annu Rev Biophys Biomol Struct. 1997;26:373–99. - PubMed
    1. Digman MA, Brown CM, Sengupta P, Wiseman PW, Horwitz AR. Measuring fast dynamics in solutions and cells with a laser scanning microscope. Biophys J. 2005;89:1317–27. - PMC - PubMed
    1. Digman MA, Wiseman PW, Choi C, Horwitz AR, Gratton E. Stoichiometry of molecular complexes at adhesions in living cells. Proc Natl Acad Sci USA. 2009;106:2170–5. - PMC - PubMed

Publication types

MeSH terms

Substances