

Association of age at diagnosis and genetic mutations in patients with neuroblastoma
- PMID: 22416102
- PMCID: PMC3527076
- DOI: 10.1001/jama.2012.228
Association of age at diagnosis and genetic mutations in patients with neuroblastoma
Abstract
Context: Neuroblastoma is diagnosed over a wide age range from birth through young adulthood, and older age at diagnosis is associated with a decline in survivability.
Objective: To identify genetic mutations that are associated with age at diagnosis in patients with metastatic neuroblastoma.
Design, setting, and patients: Whole genome sequencing was performed on DNA from diagnostic tumors and their matched germlines from 40 patients with metastatic neuroblastoma obtained between 1987 and 2009. Age groups at diagnosis included infants (0-<18 months), children (18 months-<12 years), and adolescents and young adults (≥12 years). To confirm the findings from this discovery cohort, validation testing using tumors from an additional 64 patients obtained between 1985 and 2009 also was performed. Formalin-fixed, paraffin-embedded tumor tissue was used for immunohistochemistry and fluorescence in situ hybridization. Telomere lengths were analyzed using whole genome sequencing data, quantitative polymerase chain reaction, and fluorescent in situ hybridization.
Main outcome measure: Somatic recurrent mutations in tumors from patients with neuroblastoma correlated with the age at diagnosis and telomere length.
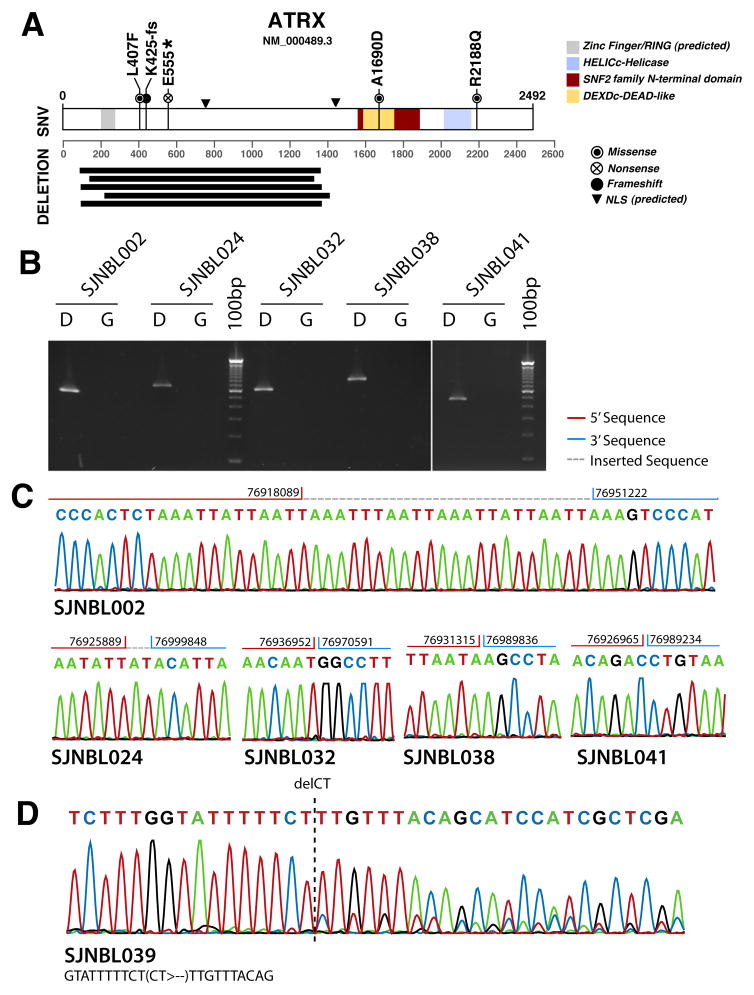
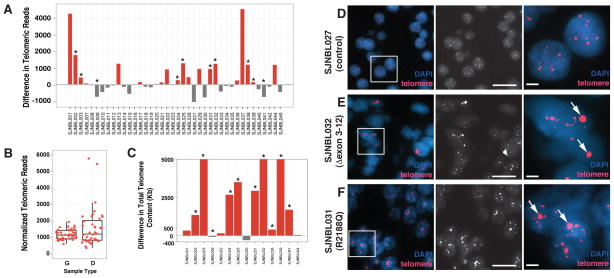
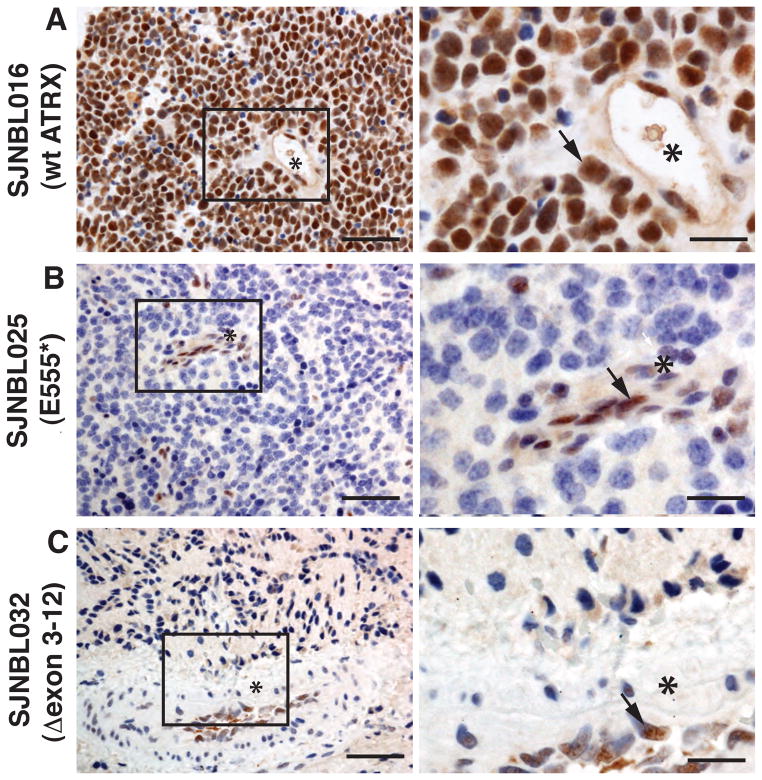
Results: In the discovery cohort (n = 40), mutations in the ATRX gene were identified in 100% (95% CI, 50%-100%) of tumors from patients in the adolescent and young adult group (5 of 5), in 17% (95% CI, 7%-36%) of tumors from children (5 of 29), and 0% (95% CI, 0%-40%) of tumors from infants (0 of 6). In the validation cohort (n = 64), mutations in the ATRX gene were identified in 33% (95% CI, 17%-54%) of tumors from patients in the adolescent and young adult group (9 of 27), in 16% (95% CI, 6%-35%) of tumors from children (4 of 25), and in 0% (95% CI, 0%-24%) of tumors from infants (0 of 12). In both cohorts (N = 104), mutations in the ATRX gene were identified in 44% (95% CI, 28%-62%) of tumors from patients in the adolescent and young adult group (14 of 32), in 17% (95% CI, 9%-29%) of tumors from children (9 of 54), and in 0% (95% CI, 0%-17%) of tumors from infants (0 of 18). ATRX mutations were associated with an absence of the ATRX protein in the nucleus and with long telomeres.
Conclusion: ATRX mutations were associated with age at diagnosis in children and young adults with stage 4 neuroblastoma.
Trial registration: clinicaltrials.gov Identifier: NCT00588068.
Figures
References
-
- Bowman LC, Hancock ML, Santana VM, et al. Impact of intensified therapy on clinical outcome in infants and children with neuroblastoma: the St Jude Children’s Research Hospital experience, 1962 to 1988. Journal of clinical oncology: official journal of the American Society of Clinical Oncology. 1991 Sep;9(9):1599–1608. - PubMed
-
- Cotterill SJ, Pearson AD, Pritchard J, et al. Clinical prognostic factors in 1277 patients with neuroblastoma: results of The European Neuroblastoma Study Group ‘Survey’ 1982–1992. European journal of cancer. 2000 May;36(7):901–908. - PubMed
-
- Ladenstein R, Lasset C, Hartmann O, et al. Impact of megatherapy on survival after relapse from stage 4 neuroblastoma in patients over 1 year of age at diagnosis: a report from the European Group for Bone Marrow Transplantation. Journal of clinical oncology: official journal of the American Society of Clinical Oncology. 1993 Dec;11(12):2330–2341. - PubMed
-
- Kushner BH, Kramer K, Cheung NK. Chronic neuroblastoma. Cancer. 2002 Sep 15;95(6):1366–1375. - PubMed
-
- Moroz V, Machin D, Faldum A, et al. Changes over three decades in outcome and the prognostic influence of age-at-diagnosis in young patients with neuroblastoma: a report from the International Neuroblastoma Risk Group Project. European journal of cancer. 2011 Mar;47(4):561–571. - PubMed
Publication types
MeSH terms
Substances
Associated data
Grants and funding
LinkOut - more resources
Full Text Sources
Other Literature Sources
Medical
