

ER and HER2 expression are positively correlated in HER2 non-overexpressing breast cancer
- PMID: 22417870
- PMCID: PMC3446380
- DOI: 10.1186/bcr3145
ER and HER2 expression are positively correlated in HER2 non-overexpressing breast cancer
Abstract
Introduction: Estrogen receptor-α (ER) and human epidermal growth factor receptor 2 (HER2) positivity are inversely correlated by standard criteria. However, we investigated the quantitative relation between ER and HER2 expression at both RNA and protein levels in HER2+ve and HER2-ve breast carcinomas.
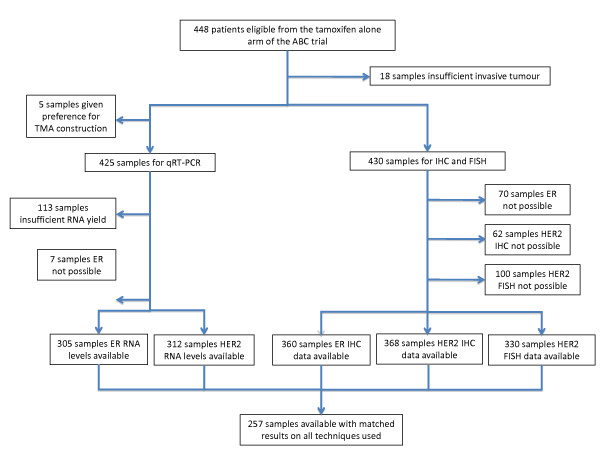
Methods: ER and HER2 levels were assessed with immunohistochemistry (IHC) and (for HER2) fluorescent in situ hybridization (FISH) and by quantitative reverse transcription-polymerase chain reaction (q-RT-PCR) in formalin-fixed primary breast cancers from 448 patients in the National Cancer Research Institute (NCRI) Adjuvant Breast Cancer Trial (ABC) tamoxifen-only arm. Relations at the RNA level were assessed in 1,139 TransATAC tumors.
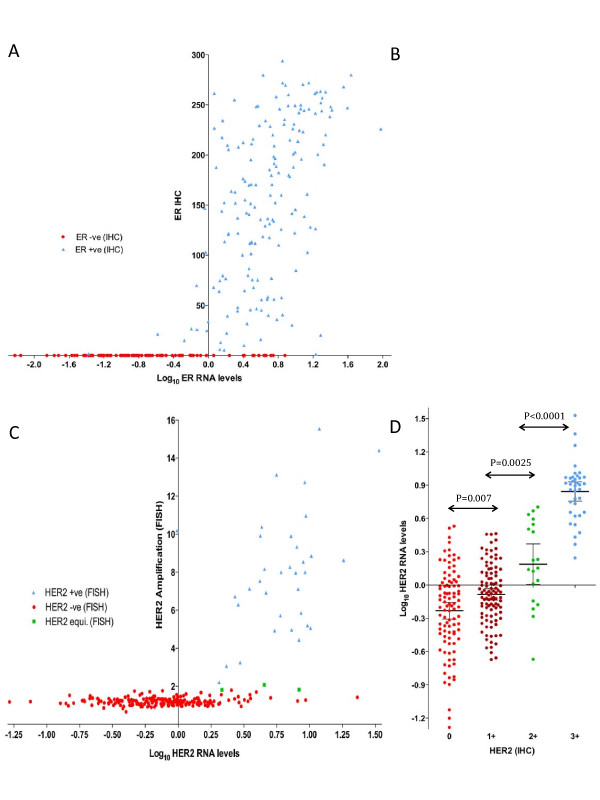
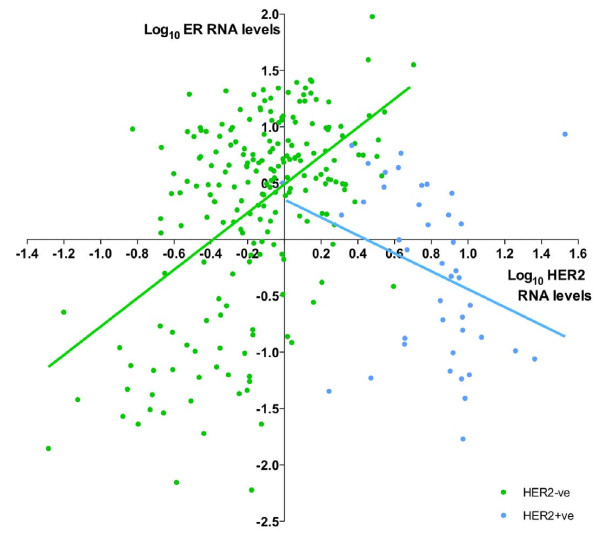
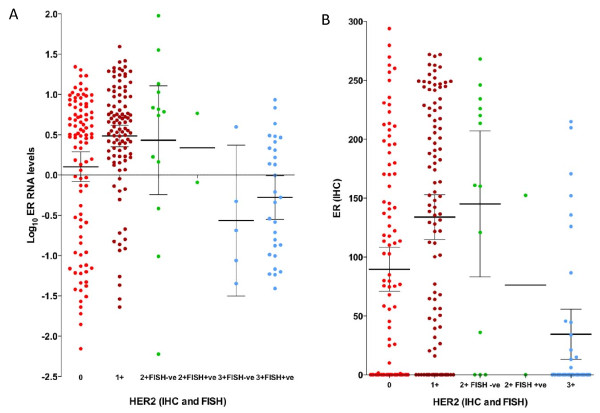
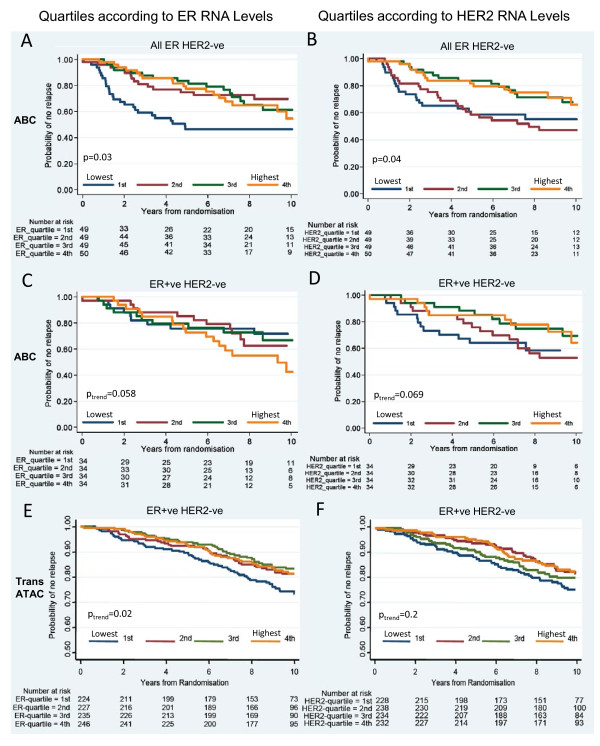
Results: ER and HER2 RNA levels were negatively correlated as expected in HER2+ve (IHC 3+ and/or FISH-amplified) tumors (r = -0.45; P = 0.0028). However, in HER2-ve tumors (ER+ve and ER-ve combined), a significant positive correlation was found (r = 0.43; P < 0.0001), HER2 RNA levels being 1.74-fold higher in ER+ve versus ER-ve tumors. This correlation was maintained in the ER+veHER2-ve subgroup (r = 0.24; P = 0.0023) and confirmed in this subgroup in 1,139 TransATAC tumours (r = 0.25; P < 0.0001). The positive relation extended to IHC-detected ER in ABC: mean ± 95% confidence interval (CI) H-scores were 90 ± 19 and 134 ± 19 for 0 and 1+ HER2 IHC categories, respectively (P = 0.0013). A trend toward lower relapse-free survival (RFS) was observed in patients with the lowest levels of ER and HER2 RNA levels within the ER+veHER2-ve subgroup both for ABC and TransATAC cohorts.
Conclusions: ER and HER2 expression is positively correlated in HER2-ve tumors. The distinction between HER2+ve and HER2-ve is greater in ER-ve than in ER+ve tumors. These findings are important to consider in clinical trials of anti-HER2 and anti-endocrine therapy in HER2-ve disease.
Trial registration: Clinical trial identifier: ISRCTN31514446.
Figures
References
-
- Harvey JM, Clark GM, Osborne CK, Allred DC. Estrogen receptor status by immunohistochemistry is superior to the ligand-binding assay for predicting response to adjuvant endocrine therapy in breast cancer. J Clin Oncol. 1999;17:1474–1481. - PubMed
-
- Press MF, Bernstein L, Thomas PA, Meisner LF, Zhou JY, Ma Y, Hung G, Robinson RA, Harris C, El-Naggar A, Slamon DJ, Phillips RN, Ross JS, Wolman SR, Flom KJ. HER-2/neu gene amplification characterized by fluorescence in situ hybridization: poor prognosis in node-negative breast carcinomas. J Clin Oncol. 1997;15:2894–2904. - PubMed
-
- Hammond ME, Hayes DF, Dowsett M, Allred DC, Hagerty KL, Badve S, Fitzgibbons PL, Francis G, Goldstein NS, Hayes M, Hicks DG, Lester S, Love R, Mangu PB, McShane L, Miller K, Osborne CK, Paik S, Perlmutter J, Rhodes A, Sasano H, Schwartz JN, Sweep FC, Taube S, Torlakovic EE, Valenstein P, Viale G, Visscher D, Wheeler T, Williams RB. et al.American Society of Clinical Oncology/College Of American Pathologists guideline recommendations for immunohistochemical testing of estrogen and progesterone receptors in breast cancer. J Clin Oncol. 2010;28:2784–2795. doi: 10.1200/JCO.2009.25.6529. - DOI - PMC - PubMed
-
- Wolff AC, Hammond ME, Schwartz JN, Hagerty KL, Allred DC, Cote RJ, Dowsett M, Fitzgibbons PL, Hanna WM, Langer A, McShane LM, Paik S, Pegram MD, Perez EA, Press MF, Rhodes A, Sturgeon C, Taube SE, Tubbs R, Vance GH, van de Vijver M, Wheeler TM, Hayes DF. American Society of Clinical Oncology/College of American Pathologists guideline recommendations for human epidermal growth factor receptor 2 testing in breast cancer. J Clin Oncol. 2007;25:118–145. - PubMed
Publication types
MeSH terms
Substances
Associated data
Grants and funding
LinkOut - more resources
Full Text Sources
Other Literature Sources
Medical
Research Materials
Miscellaneous
