. 2012 Feb 13;20(4):4710-25.
doi: 10.1364/OE.20.004710.

Split-spectrum amplitude-decorrelation angiography with optical coherence tomography

Affiliations

Split-spectrum amplitude-decorrelation angiography with optical coherence tomography

Yali Jia et al. Opt Express. .

Abstract

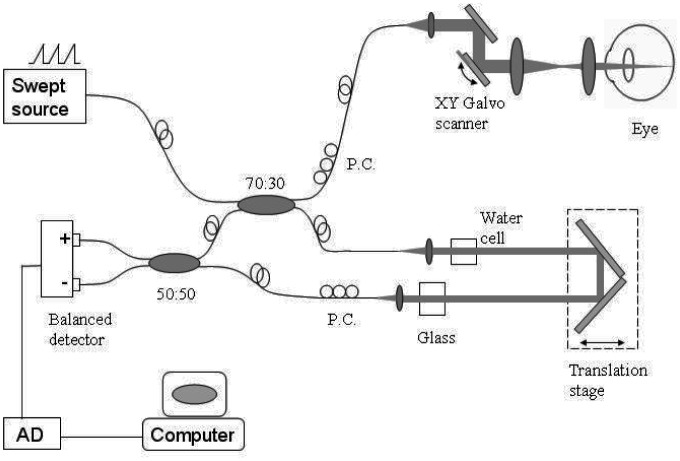
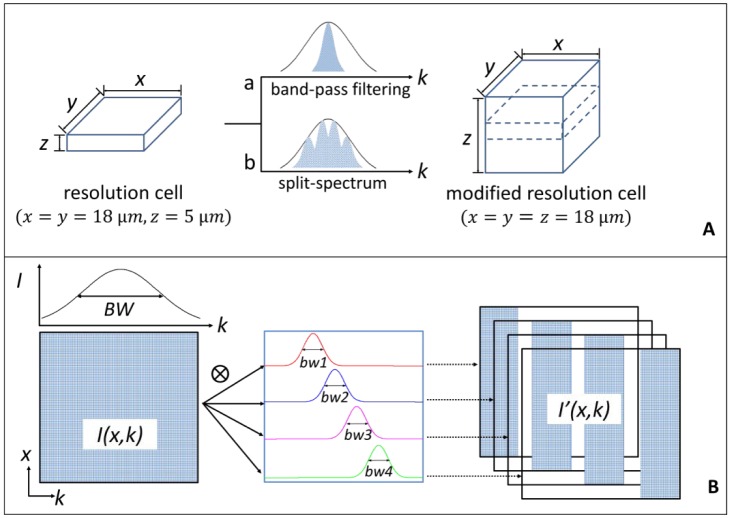
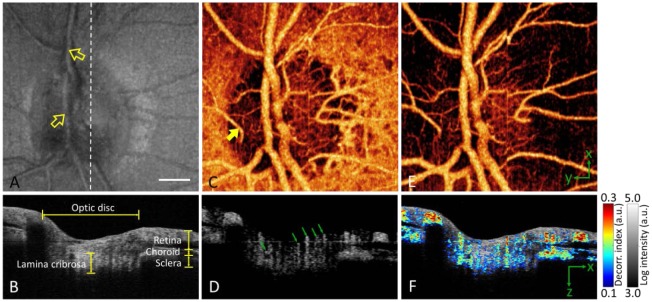
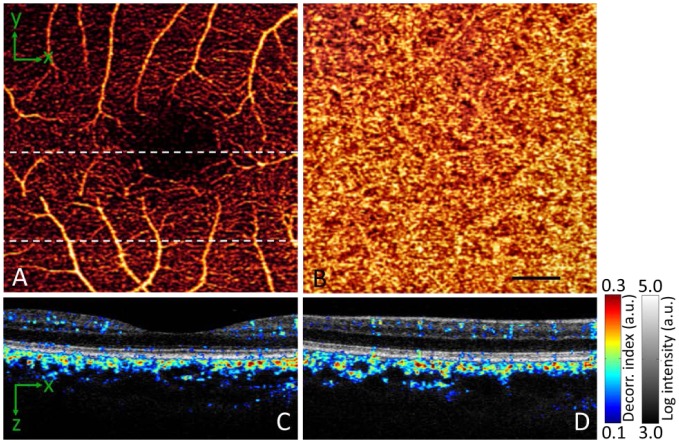
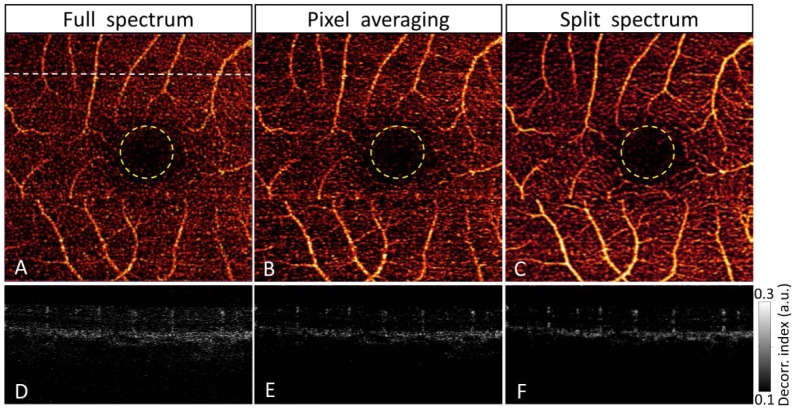
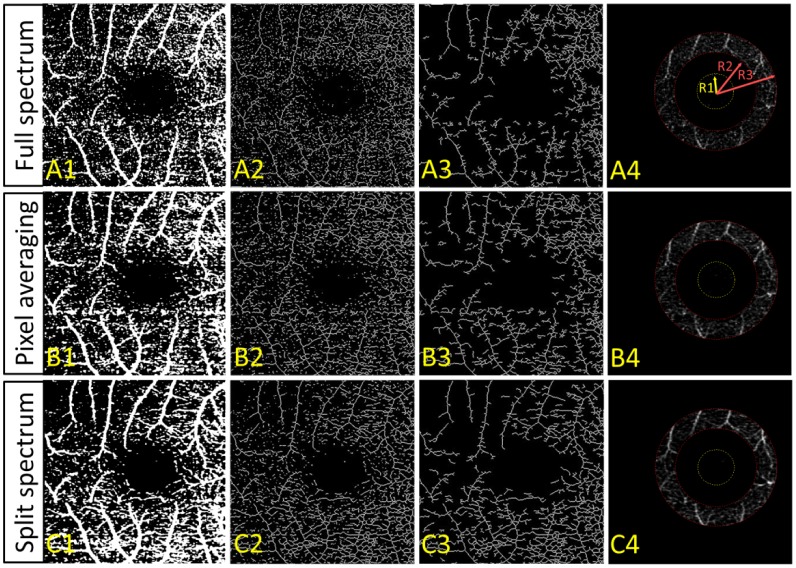
Amplitude decorrelation measurement is sensitive to transverse flow and immune to phase noise in comparison to Doppler and other phase-based approaches. However, the high axial resolution of OCT makes it very sensitive to the pulsatile bulk motion noise in the axial direction. To overcome this limitation, we developed split-spectrum amplitude-decorrelation angiography (SSADA) to improve the signal-to-noise ratio (SNR) of flow detection. The full OCT spectrum was split into several narrower bands. Inter-B-scan decorrelation was computed using the spectral bands separately and then averaged. The SSADA algorithm was tested on in vivo images of the human macula and optic nerve head. It significantly improved both SNR for flow detection and connectivity of microvascular network when compared to other amplitude-decorrelation algorithms.


Figures

Fig. 1
Fig. 1
Schematic of the swept-source OCT system used to collect the 3D image cube for split-spectrum amplitude-decorrelation angiography in a live human fundus. PC = polarization controller. AD = analog-digital conversion.
Fig. 2
Fig. 2
Diagrams of the modification of the OCT imaging resolution cell and the split-spectrum method used for this purpose. (A) The resolution cell in the current configuration can be modified into a new resolution cell by using band-pass filtering and split-spectrum methods. (B) Steps showing how the original 2D spectral interferogram I(x, k) was split into four new spectra I’(x, k) with smaller k bandwidth. “BW” and “bw” indicate the bandwidth of full-spectrum and Gaussian filters, respectively. The regions with non-zero values in the data block are indicated by the blue pattern.
Fig. 3
Fig. 3
Flow chart showing the steps for removing a decorrelation frame with high bulk motion, using an OCT section across the optic nerve head as an example. (A) A series of 7 decorrelation frames (Dn) at one Y position. To avoid clutter, only frames D1, D4, and D7 are shown. Frame D4 (yellow arrow) showed high decorrelation in both flow (vessel) and non-flow (bulk) tissue, possibly due to saccadic eye movement. To detect bulk motion, the median decorrelation value in the first 30 pixels of the inner retina and disc (between two red lines) was determined. (B) Plot of median values from the 7 frames showed frame D4 as an outlier. The threshold (dotted blue line) was set at 0.15, two standard deviations above the mean median decorrelation value. (C) After removing frame D4, the remaining six decorrelation images were averaged. (D) The cleaned decorrelation image showed high contrast between flow pixels (bright areas in retinal vessels and choroid) and non-flow dark regions. (E) If frame D4 were not removed, the uncleaned decorrelation image showed less contrast between flow and non-flow pixels, which was evident by the lack of completely dark space between retinal vessels in the peripapillary areas (circled by dotted yellow lines).
Fig. 4
Fig. 4
In vivo 3D volumetric [3.0 (x) × 3.0 (y) × 2.9 (z) mm] OCT of the optic nerve head in the right eye of a myopic individual. White bar, 500 µm. The images in the bottom panels have been cropped from 2.9 mm to 1.5 mm axially. (A) En face maximum reflectance intensity projection showed branches of the central retinal artery and vein (yellow arrows point to superior branches). (B) OCT cross-section at the plane marked by white dashed line in (A). (C) En face maximum decorrelation projection angiogram computed with the SSADA algorithm. It showed many orders of branching from the central retinal artery and vein, a dense capillary network in the disc, a cilioretinal artery (yellow arrow), and a near continuous sheet of choroidal vessels around the disc. (D) Decorrelation cross-section (same plane as B) showed blood flow in disc vessels (green arrows), peripapillary retinal vessels, and choroid. (E) En face maximum decorrelation projection angiogram after removing the choroid (pixels below the retinal pigment epithelium). (F) Fly-through movie ( Media 1), in which flow (color scale representing decorrelation) was merged with structure (gray scale representing reflectance intensity), showed how the disc, retina, and choroid are perfused in a 3D volumetric fashion. A fixed pattern artifact originated from the swept laser source and resulted in a horizontal lines across the image [31].
Fig. 5
Fig. 5
In vivo 3D volumetric [3.0 (x) × 3.0 (y) × 2.9 (z) mm] OCT of the macula processed with the SSADA algorithm. The images in the bottom panels have been cropped from 2.9 mm to 1.5 mm axially. (A) En face maximum decorrelation projection angiogram of the retinal circulation. (B) En face maximum decorrelation projection angiogram of the choroidal circulation. Black bar, 500 µm. (C) Horizontal OCT cross section through the foveal center (upper dashed line in A) with merged flow (decorrelation represented in color scale) and structure (reflectance intensity represented in gray scale) information. (D) Merged horizontal cross section of the inferior macula (lower dashed line in A).
Fig. 6
Fig. 6
Comparison of amplitude-decorrelation angiography using three different algorithms: full-spectrum (A, D), pixel-averaging (B. E) and split-spectrum (C, F). The macula was scanned in a 3x3 mm area. En face maximum decorrelation projections of retinal layers (A-C) showed the macular vascular network around the central foveal avascular zone (yellow circles) of 600-µm diameter. The cross-sectional angiograms (D-F) scanned across a horizontal line in the superior perifoveal region (upper dashed line of A). White bar, 500 µm.
Fig. 7
Fig. 7
(A) Full-spectrum, (B) pixel-averaging, and (C) split-spectrum amplitude decorrelation angiography algorithms were applied to map the retinal circulation in a normal macula. The en face maximum projection decorrelation images (Fig. 6(A-C)) were binarized (Column 1), skeletonized (Column 2), and then filtered to remove unconnected flow pixels (Column 3). The ratio of the number connected flow pixels to the total number of flow pixels on the skeleton map is the vascular connectivity. The algorithms were also compared in terms of the decorrelation signal-to-noise ratio, where the noise region was inside the foveal avascular zone (Column 4 yellow circles), and the signal region was the parafoveal annulus (Column 4 between two red circles). R1 = 0.3 mm, R2 = 0.65 mm, and R3 = 1 mm.

References

    1. Huang D., Swanson E. A., Lin C. P., Schuman J. S., Stinson W. G., Chang W., Hee M. R., Flotte T., Gregory K., Puliafito C. A., Fujimoto J. G., “Optical coherence tomography,” Science 254(5035), 1178–1181 (1991).10.1126/science.1957169 - DOI - PMC - PubMed
    1. Fercher A. F., Hitzenberger C. K., Kamp G., El-Zaiat S. Y., “Measurement of intraocular distances by backscattering spectral interferometry,” Opt. Commun. 117(1–2), 43–48 (1995).10.1016/0030-4018(95)00119-S - DOI
    1. Hausler G., Lindner M. W., ““'Coherence radar” and 'spectral radar'–new tools for dermatological diagnosis,” J. Biomed. Opt. 3(1), 21–31 (1998).10.1117/1.429899 - DOI - PubMed
    1. Chinn S. R., Swanson E. A., Fujimoto J. G., “Optical coherence tomography using a frequency-tunable optical source,” Opt. Lett. 22(5), 340–342 (1997).10.1364/OL.22.000340 - DOI - PubMed
    1. Haberland U. H. P., Blazek V., Schmitt H. J., “Chirp optical coherence tomography of layered scattering media,” J. Biomed. Opt. 3(3), 259–266 (1998).10.1117/1.429889 - DOI - PubMed

Publication types