. 2012 Apr;7(4):350-60.
doi: 10.4161/epi.19507. Epub 2012 Apr 1.

Epigenetic reprogramming of cancer cells via targeted DNA methylation

Affiliations

Epigenetic reprogramming of cancer cells via targeted DNA methylation

Ashley G Rivenbark et al. Epigenetics. 2012 Apr.

Abstract

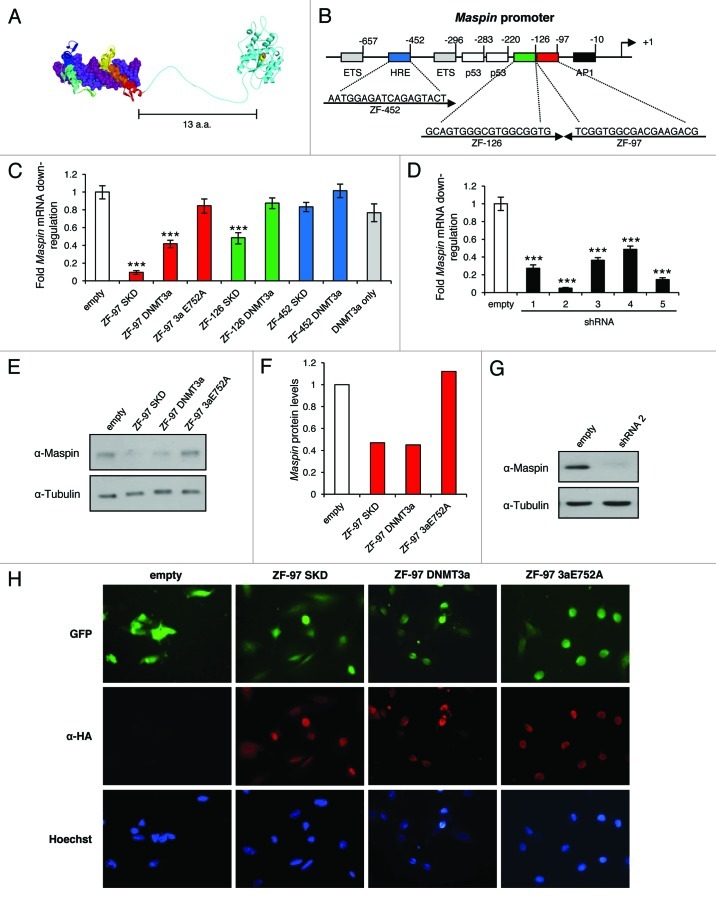
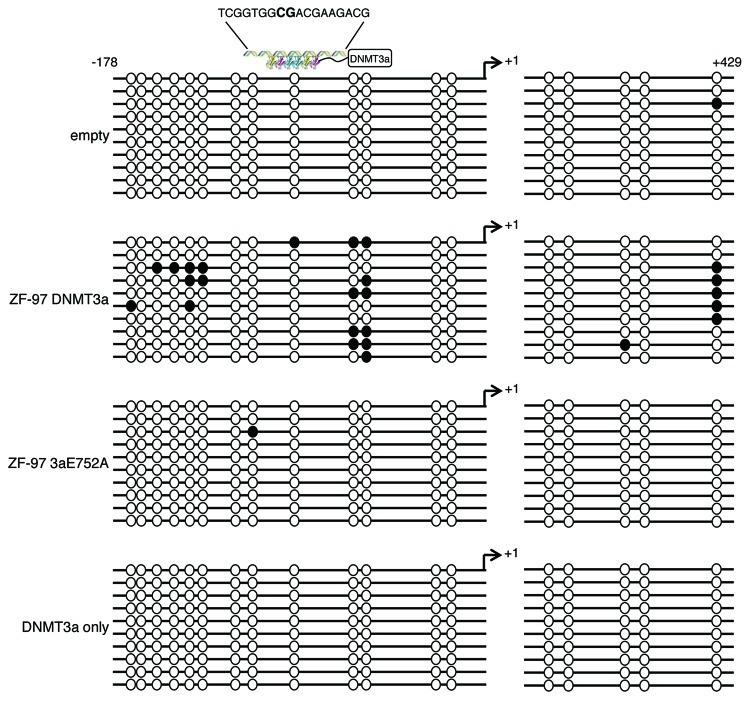
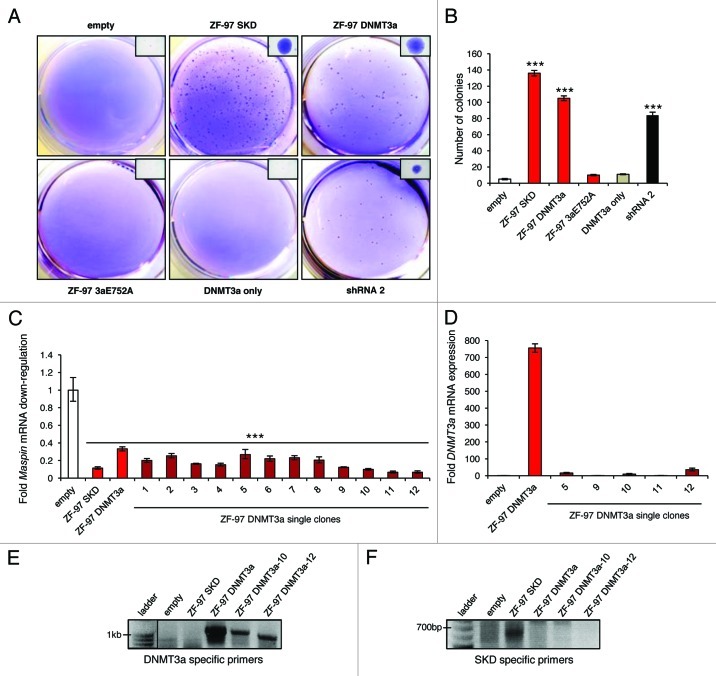
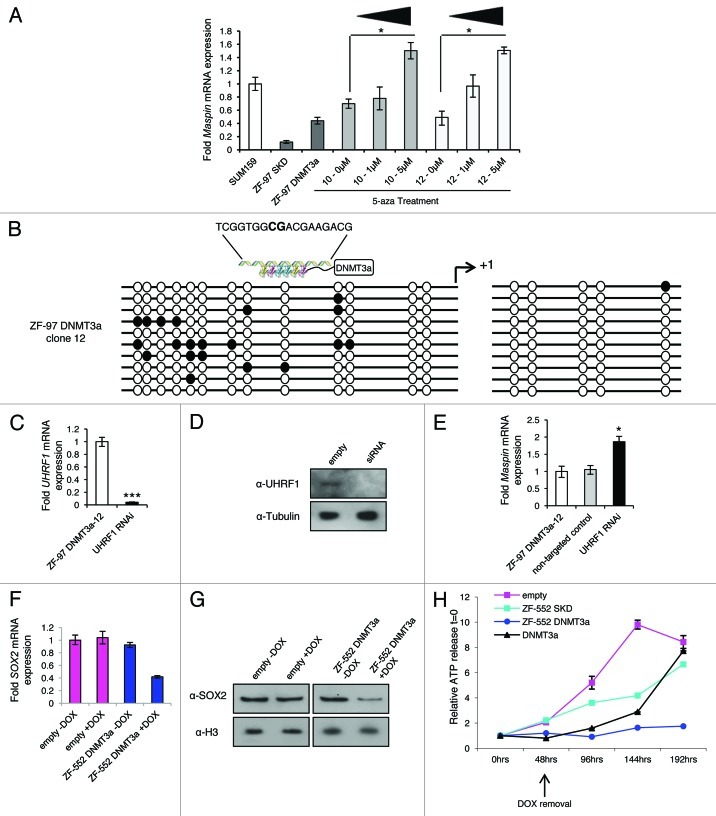
An obstacle in the treatment of human diseases such as cancer is the inability to selectively and effectively target historically undruggable targets such as transcription factors. Here, we employ a novel technology using artificial transcription factors (ATFs) to epigenetically target gene expression in cancer cells. We show that site-specific DNA methylation and long-term stable repression of the tumor suppressor Maspin and the oncogene SOX2 can be achieved in breast cancer cells via zinc-finger ATFs targeting DNA methyltransferase 3a (DNMT3a) to the promoters of these genes. Using this approach, we show Maspin and SOX2 downregulation is more significant as compared with transient knockdown, which is also accompanied by stable phenotypic reprogramming of the cancer cell. These findings indicate that multimodular Zinc Finger Proteins linked to epigenetic editing domains can be used as novel cell resources to selectively and heritably alter gene expression patterns to stably reprogram cell fate.


Figures

None
Figure 1. ATFs downregulate Maspin in SUM159 cells. (A) Structural model of 6 zinc finger domains linked by 13 amino acids to DNMT3a methyltransferase catalytic domain. (B) Schematic represents the ZF-452 (blue), ZF-126 (green), ZF-97 (red) sequences and their location from the transcription start site (arrow +1). (C) qRT-PCR results for Maspin expression in transduced cells. Red bars correspond to ZF-97 with SKD, catalytic domain of DNMT3a, and DNMT3a E752A. Green bars correspond to ZF-126 with SKD and DNMT3a domains. Blue bars correspond to ZF-452 with SKD and DNMT3a domains. Gray bar corresponds to the DNMT3a only and the white bar corresponds to empty vector control. Maspin expression level is depicted relative to that of the empty vector control. Error bars represent SEM. Statistical significance was analyzed using a t test (***p < 0.0001). (D) qRT-PCR results for Maspin expression. Black bars correspond to five different shRNA constructs that target Maspin and the white bar corresponds to empty vector control. Maspin expression level is depicted relative to that of the empty vector control. Error bars represent SEM. Statistical significance was analyzed using a t test (***p < 0.0001). (E) western blot analysis of Maspin protein levels in cells transduced with empty, ZF-97 SKD, ZF-97 DNMT3a, and ZF-97 3aE752A constructs. Tubulin is used as a loading control. (F) Quantification of Maspin protein levels relative to Tubulin. (G) western blot analysis of Maspin protein levels in cells after shRNA-mediated knockdown of Maspin. Tubulin is a loading control. (H) Detection of the retrovirus (GFP, green) and ZF-97 (α-HA, red) by immunofluorescence in cells. Nuclear staining was performed using Hoechst (blue). Images taken at 40x.
None
Figure 2. ZF-97 DNMT3a represses Maspin by targeted DNA methylation. Bisulfite sequence analysis for Maspin. Methylated CpGs are designated by closed circles, unmethylated CpGs are designated by open circles for cells transduced with empty vector, ZF-97 DNMT3a, ZF-97 3aE752A, and DNMT3a only (10 replicates each). Transcription start site indicated by arrow +1. ATF binding site depicted by 6 ZF proteins linked with a C-terminal DNMT3a domain with the sequence shown above. CG site within ZF-97 sequence shown in bold capital letters.
None
Figure 3. Downregulation of Maspin by targeted DNA methylation increases breast cancer cell colony formation (A) Soft agar assay results from cells transduced with empty vector, ZF-97 SKD, ZF-DNMT3a, ZF-97 3aE752A, DNMT3a only, and shRNA 2. Representative images of the entire agar well stained with Crystal Violet are shown along with a closer image of a single colony (in upper right corner). (B) Quantification of colony number. The white bar corresponds to empty vector control, the red bars correspond to ZF-97, the gray bar corresponds to DNMT3a only, and the black bar corresponds to shRNA 2. Error bars represent SEM. Statistical significance was analyzed using a t test (***p < 0.0001). (C) qRT-PCR results for Maspin expression in ZF-97 DNMT3a single clones (dark red bars 1–12) picked from soft agar and grown in culture for > 50 generations. The white bar corresponds to empty vector control and the red bars correspond to ZF-97 SKD and ZF-97 DNMT3a (parental pool) included for technical reference. Maspin expression level is depicted relative to that of the empty vector control. Error bars represent SEM. Statistical significance was analyzed using a t test (***p < 0.0001). (D) qRT-PCR results for the DNMT3a construct expression in select ZF-97 DNMT3a single clones (dark red bars). DNMT3a expression level is depicted relative to that of the empty vector control and the parental ZF-97 DNMT3a is included for technical reference. (E) Agarose gels from genomic DNA extracted from cells transduced with the empty vector, ZF-97 SKD, ZF-97 DNMT3a, ZF-97 DNMT3a single clones 10 and 12. Line indicates a lane on the same gel but was separated from subsequent lanes. Amplicons demonstrate products obtained with DNMT3a specific primers and (F) SKD specific primers.
None
Figure 4.Maspin is stably and heritably repressed by DNA methylation and ZF-552 DNMT3a downregulates SOX2 in MCF7 cells resulting in reduced cell proliferation. (A) qRT-PCR results for Maspin expression in ZF-97 DNMT3a single colony cells treated with 1µM and 5µM of 5-aza. Error bars represent SEM. Statistical significance was analyzed using a t test (*p < 0.05). (B) Bisulfite sequence analysis for Maspin in ZF-97 DNMT3a clone 12. Methylated CpGs are designated by closed circles; unmethylated CpGs are designated by open circles (10 replicates each). Transcription start site indicated by arrow +1. ATF depicted by 6 ZF proteins linked with a DNMT3a domain with the sequence shown above. CG site within ZF-97 sequence shown in bold capital letters. (C) qRT-PCR results for UHRF1 expression after RNAi-mediated UHRF1 knockdown in ZF-97 DNMT3a clone 12 cells. Black bar correspond to RNAi and the white bar corresponds to ZF-97 DNMT3a clone 12 before knockdown. UHRF1 expression level is depicted relative to that of ZF-97 DNMT3a clone 12. Error bars represent SEM. Statistical significance was analyzed using a t test (***p < 0.0001). (D) western blot analysis of UHRF1 protein levels in cells after siRNA-mediated knockdown of UHRF1. Tubulin is used as a loading control. (E) qRT-PCR results for Maspin expression after RNAi-mediated UHRF1 knockdown in ZF-97 DNMT3a clone 12 cells. Black bar corresponds to RNAi, the gray bar corresponds to a non-targeted control, and the white bar corresponds to ZF-97 DNMT3a clone 12 before knockdown. Maspin expression level is depicted relative to that of ZF-97 DNMT3a clone 12. Error bars represent SEM. Statistical significance was analyzed using a t test (*p < 0.05). (F) qRT-PCR results for SOX2 expression in transduced cells. Pink bars correspond to empty vector (- or +DOX) and blue bars correspond to ZF-552 DNMT3a. (G) western blot analysis of SOX2 protein levels in cells either un-induced (-DOX) or induced (+DOX) with empty vector and ZF-552 DNMT3a. Histone H3 is used as a loading control. (H) A representative time course cell viability assay with cells induced with DOX at t = 0. At 48 h post-induction the DOX was removed from the cell medium. Cell viability is measured by fold increase in ATP release related to t = 0. Error bars represent SEM.

References

    1. Kouzarides T. Chromatin modifications and their function. Cell. 2007;128:693–705. doi: 10.1016/j.cell.2007.02.005. - DOI - PubMed
    1. Hashimoto H, Vertino PM, Cheng X. Molecular coupling of DNA methylation and histone methylation. Epigenomics. 2010;2:657–69. doi: 10.2217/epi.10.44. - DOI - PMC - PubMed
    1. Klose RJ, Bird AP. Genomic DNA methylation: the mark and its mediators. Trends Biochem Sci. 2006;31:89–97. doi: 10.1016/j.tibs.2005.12.008. - DOI - PubMed
    1. Bird A. DNA methylation patterns and epigenetic memory. Genes Dev. 2002;16:6–21. doi: 10.1101/gad.947102. - DOI - PubMed
    1. Jurkowska RZ, Jurkowski TP, Jeltsch A. Structure and function of mammalian DNA methyltransferases. Chembiochem. 2011;12:206–22. doi: 10.1002/cbic.201000195. - DOI - PubMed

Publication types

MeSH terms