. 2012 Mar;190(3):885-929.
doi: 10.1534/genetics.111.133306.

Regulation of amino acid, nucleotide, and phosphate metabolism in Saccharomyces cerevisiae

Affiliations

Regulation of amino acid, nucleotide, and phosphate metabolism in Saccharomyces cerevisiae

Per O Ljungdahl et al. Genetics. 2012 Mar.

Abstract

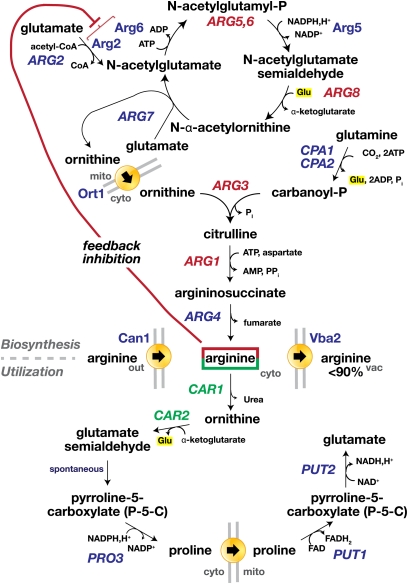
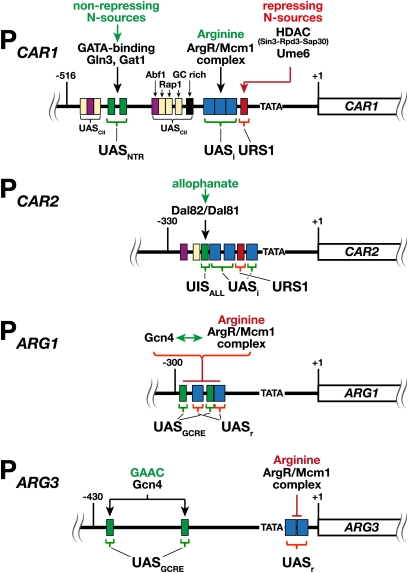
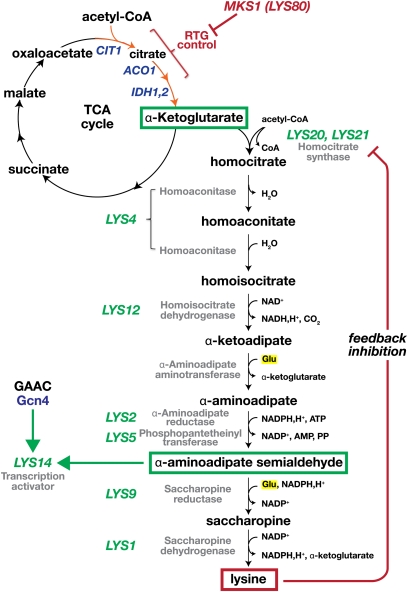
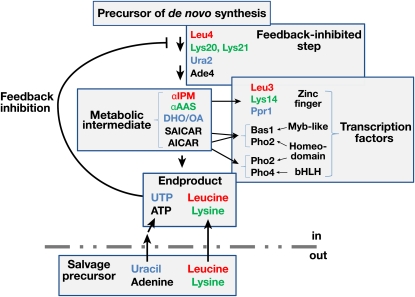
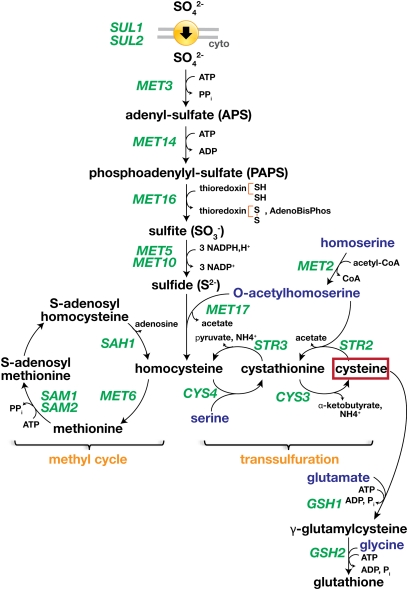
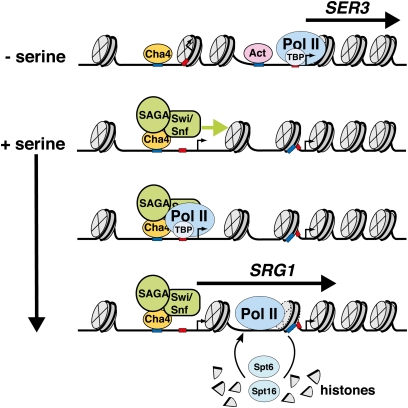
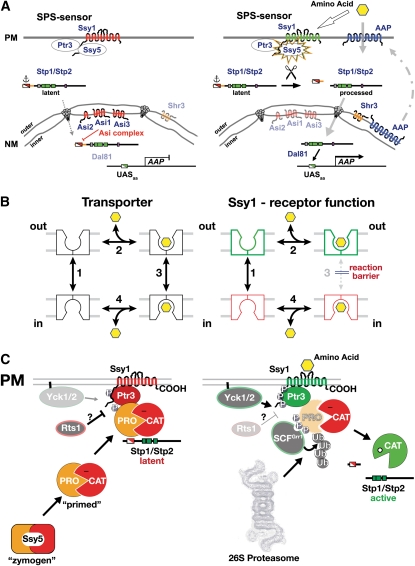
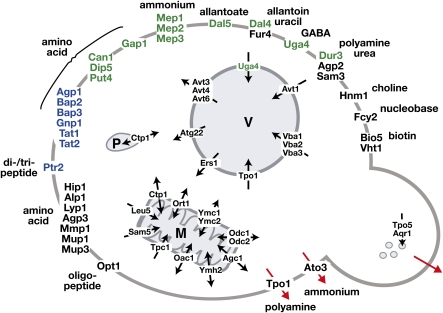
Ever since the beginning of biochemical analysis, yeast has been a pioneering model for studying the regulation of eukaryotic metabolism. During the last three decades, the combination of powerful yeast genetics and genome-wide approaches has led to a more integrated view of metabolic regulation. Multiple layers of regulation, from suprapathway control to individual gene responses, have been discovered. Constitutive and dedicated systems that are critical in sensing of the intra- and extracellular environment have been identified, and there is a growing awareness of their involvement in the highly regulated intracellular compartmentalization of proteins and metabolites. This review focuses on recent developments in the field of amino acid, nucleotide, and phosphate metabolism and provides illustrative examples of how yeast cells combine a variety of mechanisms to achieve coordinated regulation of multiple metabolic pathways. Importantly, common schemes have emerged, which reveal mechanisms conserved among various pathways, such as those involved in metabolite sensing and transcriptional regulation by noncoding RNAs or by metabolic intermediates. Thanks to the remarkable sophistication offered by the yeast experimental system, a picture of the intimate connections between the metabolomic and the transcriptome is becoming clear.


Figures

Figure 1
Figure 1
Schematic diagram of the main pathways of nitrogen metabolism. The entry routes of several nitrogen sources into the central core reactions are shown. The class A preferred and class B nonpreferred nitrogen sources are in green and red text, respectively. The nitrogen of preferred nitrogen sources is incorporated into glutamate, and the resulting carbon skeletons are shunted into pyruvate and α-ketoglutarate. Nitrogen from branched-chain amino acids, aromatic amino acids, and methionine (within box) is transferred to α-ketoglutarate by transaminases forming glutamate; the resulting deaminated carbon skeletons are converted to noncatabolizable and growth-inhibitory fusel oils (Hazelwood et al. 2008). Nitrogenous compounds are synthesized with nitrogen derived from glutamate or glutamine as indicated (blue arrows). Central anabolic reactions 1 and 2 are catalyzed by NADPH-dependent glutamate dehydrogenase (GDH1) and glutamine synthetase (GLN1). Central catabolic reactions 3 and 4 are catalyzed by NADH-dependent glutamate synthase (GLT1) and NAD+-linked glutamate dehydrogenase (GDH2). For detailed descriptions of the pathways, the reader is referred to the SGD (http://pathway.yeastgenome.org/) or KEGG (http://www.genome.jp/kegg/pathway.html) databases.
Figure 2
Figure 2
General scheme for the biosynthesis of amino acids from glucose and ammonia. Ammonia is incorporated during the formation of glutamate from α-ketoglutarate (reaction 1) by NADPH-dependent glutamate dehydrogenase (GDH1) and of glutamine from glutamate (reaction 2) by glutamine synthetase (GLN1). The transamination reactions transferring nitrogen from glutamate (yellow) or glutamine (green) are shown. For detailed descriptions of the pathways, the reader is referred to the SGD (http://pathway.yeastgenome.org/) or KEGG (http://www.genome.jp/kegg/pathway.html) databases.
Figure 3
Figure 3
Model of GATA factor and NCR-controlled gene expression. The promoters of GAT1, GZF3, and DAL80 contain multiple GATAAG sequences, and their expression is sensitive to NCR. These factors regulate each other’s expression (cross-regulation) and in certain instances exhibit partial autogenous regulation. GAT1 and DAL80 expression is primarily dependent on Gln3 and Dal80; the expression of these factors is the highest in cells grown under nonrepressive conditions. Inactivation of GZF3 results in the derepressed expression of several NCR-sensitive genes including GAT1, indicating that, in contrast to Dal80, Gzf3 is expressed at functionally significant levels and active in the presence of repressing nitrogen sources. Consistent with this latter finding, GZF3 expression is induced by Gat1 under conditions when Gln3 is apparently inactive (Rowen et al. 1997). Gzf3 maintains low levels of GAT1 expression by competing with Gat1 at GATAAG-binding sites; in essence, these two factors participate in an autoregulatory loop. Green lines and arrows indicate positive regulation; red lines and bars indicate negative regulation; and dashed lines reflect relatively weaker regulation. The model is modified from Coffman et al. (1997) and Georis et al. (2009a).
Figure 4
Figure 4
Schematic depiction of the GAAC pathway and the global affect of Gcn4-dependent transcription. (A) GAAC is activated when the levels of any amino acid become limiting, leading to alterations in the pools of charged tRNAs (Zaborske et al. 2009, 2010). Uncharged tRNAs bind and activate the Gcn2 kinase, which phosphorylates Ser-51 of the α-subunit of the translation initiation factor eIF2 (Wek et al. 1989; Dong et al. 2000; Qiu et al. 2001). The phosphorylated eIF2α exhibits an enhanced affinity for the GTP-GDP exchange factor eIF2Β (GEF), competitively inhibiting the rate of nucleotide exchange, resulting in a reduction in the rate of TC eIF2-GTP-Met-tRNAi formation (gray dashed arrows). (B) The gene encoding the transcription factor Gcn4, the effector of GAAC, is transcribed as an mRNA with four small open reading frames in the 5′-untranslated region (uORF; boxes 1–4) (Mueller and Hinnebusch 1986). As a scanning 40S ribosome with a TC (light green) encounters the first initiator codon of uORF1, the GTP bound to the TC is hydrolyzed to GDP, releasing the eIF2-GDP, and the 60S ribosome is recruited and translation initiates (80S ribosome, dark green). Translation terminates at the uORF1 stop codon, and the 60S ribosome dislocates; the 40S ribosome continues to scan but is unable (red) to initiate translation until it reacquires a TC. Under non-inducing conditions with a high level of TC, the 40S ribosome regains competence (light green) to initiate translation at uORF4. The translation of uORF4 interferes with initiation at GCN4. Under GAAC-inducing conditions, due to a low level of ternary complex, the 40S ribosome regains competence after passing uORF4 and initiates translation at GCN4. (C) Gcn4 binds to promoters of genes possessing the consensus UASGCRE sequence motif GAGTCA. Activation of GAAC leads to major reprograming of transcription (>500 genes are induced and >1000 are repressed) (Natarajan et al. 2001). The number of induced genes (parentheses) in the categories of proteins relevant to amino acid and nucleotide metabolism is indicated. As indicated in A, a variety of stimuli have been shown to result in increased levels of Gcn4 (Hinnebusch and Natarajan 2002). Some of these responses impinge directly on Gcn2 (Cherkasova et al. 2010; Zaborske et al. 2009, 2010) and some function independently, apparently in parallel. Notably, Gcn4 stability is increased under amino acid starvation (Kornitzer et al. 1994; Shemer et al. 2002; Bomeke et al. 2006; Aviram et al. 2008; Streckfuss-Bomeke et al. 2009).
Figure 5
Figure 5
Arginine metabolic network. Arginine is primarily transported into cells by the arginine permease Can1 (Table 4), and once internalized, the bulk of arginine is transported into the vacuole by the Vba2 transporter (Table 6). Cytoplasmic arginine exerts positive (green) and negative (red) effects on gene expression encoding enzymes required for arginine utilization and catabolism, respectively. Both positive and negative regulation relies on the ArgM/Mcm1 complex, which in an arginine-dependent manner participates in activating the expression of the genes in green and repressing the genes in red. (Arginine utilization; bottom) Arginine is degraded to form glutamate. Arginine is initially degraded in the cytoplasm to form proline; this requires the concerted action of arginase (CAR1) and ornithine aminotransferase (CAR2) to form glutamate γ-semialdehyde, which spontaneously converts to Δ1-pyrroline-5-carboxylate (P5C). P5C is converted to proline by the PRO3 gene product. Cytoplasmic proline is transported into the mitochondria where it is converted back to P5C by proline oxidase (PUT1). Finally, the mitochondrial P5C is converted to glutamate by the PUT2 gene product. Whereas CAR1 and CAR2 are positively regulated by the presence of arginine (discussed below), the expression of PUT1 and PUT2 is induced by proline (Marczak and Brandriss 1989; Siddiqui and Brandriss 1989). Proline binds directly to the transcription factor Put3, a member of the well-studied Zn(II)2Cys6 binuclear cluster family of transcriptional regulators (Des Etages et al. 2001). The activation of Put3 requires no additional components and can be induced by certain proline analogs with an unmodified pyrrolidine ring (Sellick and Reece 2003). Detailed structural analysis indicates that proline directly controls the regulatory properties of transcriptional activator, providing a clear demonstration of how metabolite recognition and transcriptional control can be directly coupled (Sellick and Reece 2005). (Arginine biosynthesis; top) The first five steps of biosynthesis take place in the mitochondria (ARG2, ARG5,-6, ARG8, ARG7) and result in the synthesis of ornithine. ARG5,-6 encode the enzymes that catalyze the second and third steps and are translated into a pre-protein that is imported into mitochondria, where it is cleaved, resulting in separate proteins, i.e., N-acetylglutamate kinase (Arg6) and N-acetylglutamyl-phosphate reductase (Arg5) (Boonchird et al. 1991). The first two enzymes in the pathway, N-acetylglutamate synthase (Arg2) and N-acetylglutamate kinase (Arg6), bind each other, forming a complex that is necessary for their stability and for feedback inhibition by arginine (Abadjieva et al. 2000, 2001; Pauwels et al. 2003). The ornithine synthesized in mitochondria is transported to the cytoplasm via the mitochondrial carrier protein Ort1 (Table 5), and the remaining steps are carried out in the cytoplasm. Carbomoyl phosphate reacts with ornithine to form arginine in three steps (ARG3, ARG1, ARG4). Carbomoyl phosphate is synthesized from CO2, ATP, and the amide nitrogen of glutamine in a reaction catalyzed by the arginine-specific carbomoyl phosphate synthetase, a heterodimeric enzyme composed of a small regulatory subunit (CPA1) and a catalytic subunit (CPA2).
Figure 6
Figure 6
Schematic diagram of the arginine-sensitive promoters PCAR1, PCAR2, PARG1, and PARG3. PCAR1 and PCAR2 are induced, whereas PARG1 and PARG3 are repressed by arginine in an ArgR/Mcm1-dependent manner. The promoter elements, i.e., the sites for specific DNA-binding proteins, are color coded as follows: red, URS1 (Ume6 binding); blue, UASi and UASr (ArgR/MCM1 binding); black, GC rich; light yellow, Rap1; purple, Abf1; green, UASNTR (PCAR1; GATA factor Gln3 and Gat1 binding), UISALL (PCAR2; Dal82/Dal81 binding), or UASGCRE (PAGR1 and PARG3; Gcn4 binding). Coordinates are relative to the translation start sites.
Figure 7
Figure 7
Lysine biosynthetic pathway. LYS gene expression is controlled in response to the levels of α-AAS. This pathway intermediate binds and activates the pathway-specific transcription factor Lys14. As a consequence of a pathway intermediate controlling Lys14, conditions that increase or decrease the flux through the pathway, positively or negatively, affect LYS gene expression, respectively. The pathway is stimulated by the precursor α-ketoglutarate and consistently activated in cells lacking MKS1. Conversely, due to feedback inhibition of the first step of the pathway (catalyzed by either Lys20 or Lys21), excess lysine reduces the production of α-AAS and causes apparent repression of the LYS genes. LYS14 is subject to GAAC regulation, which suggests that derepression of all eight LYS genes under amino acid starvation conditions is mediated through Gcn4-induced LYS14 expression (Natarajan et al. 2001).
Figure 8
Figure 8
Transcriptional regulation of biosynthetic pathways by metabolic intermediates. The expression of genes encoding catalytic components in the lysine (green), leucine (red), pyrimidine (blue), and purine (black) is controlled by pathway-specific transcription factors that induce transcription upon binding a metabolic intermediate of the pathway. In these pathways, feedback inhibition by the end product of the first and committing step of the pathway provides the means to decrease the production of the inducer and cause the apparent repression of the pathway. This dual-sensing mechanism permits fine-tuning of biosynthetic pathways by integrating both the final end-product concentration, whether synthesized or transported into cells via salvage mechanisms, and the flux in the pathway (as sensed via the concentration of strategic metabolic intermediates).
Figure 9
Figure 9
Sulfur metabolic network. Three major branches of the sulfur metabolic network have been defined. First, sulfate is transported into cells via the sulfate permeases (SUL1 and SUL2) and is reduced to sulfide (MET3, MET14, MET16, MET5, and MET10). Second, sulfide is incorporated in the formation of homocysteine (MET17) from O-acetylhomoserine that is derived from homoserine (MET2). Third, homocysteine is converted to methionine and SAM in the methyl cycle (MET6, SAM1, SAM2, SAH1) or converted to cysteine in the two steps of the trans-sulfuration pathway (CYS4 and CYS3). Glutathione is synthesized from cysteine (GSH1, GSH2). The sulfur-containing compounds are written in black. The levels of cysteine negatively control the activity of Met4-dependent transcription. The genes under positive control by Met4 are indicated in green.
Figure 10
Figure 10
Model for the repression of SER3 by SRG1 intergenic transcription. In the absence of serine, the Cha4 activator is bound to the SRG1 promoter but is unable to initiate transcription. The SER3 promoter is depleted of nucleosomes allowing proteins, either an as-yet-unknown sequence-specific activator or general transcription factors, to bind and activate SER3 transcription. In response to serine, Cha4 recruits SAGA and Swi/Snf to reposition the nucleosomes at the 5′ end of SRG1 toward the SER3 promoter, permitting initiation of SRG1 transcription. These repositioned nucleosomes are then disassembled ahead of the transcribing RNA Pol II and reassembled after passage of RNA Pol II by the Spt6 and Spt16 histone chaperones. The nucleosomes being maintained by SRG1 transcription occlude the SER3 promoter, preventing the binding of transcription factors and SER3 transcription. This figure and legend, orginally published in Pruneski and Martens (2011), are reproduced in accordance with Landes Bioscience policy, the publishers of Cell Cycle, with permission of the authors.
Figure 11
Figure 11
Schematic diagram of the SPS-sensing pathway of extracellular amino acids. (A) In cells grown in the absence of inducing amino acids (left), the SPS sensor of extracellular amino acids is present in the plasma membrane (PM) in its preactivation conformation (Forsberg and Ljungdahl 2001a), and the transcription of SPS-sensor-regulated genes, i.e., amino acid permeases (AAP), occurs at basal levels, and cells exhibit low rates of amino acid uptake. The transcription factors Stp1 and Stp2 (DNA-binding motifs, green boxes) are synthesized as inactive precursors that localize to the cytosol due to the presence of their N-terminal regulatory domain (anchor) that prevents them from efficiently entering the nucleus. Low levels of full-length Stp1 and Stp2 that escape cytoplasmic retention (dashed arrow, left panel) are prevented from derepressing AAP gene expression due to activity of the Asi complex (Asi1–Asi2–Asi3) (Boban et al. 2006; Zargari et al. 2007). In the presence of extracellular amino acids (right panel), the SPS (Ssy1-Ptr3-Ssy5) sensor activates the intrinsic proteolytic activity of the Ssy5 protease, resulting in the endoproteolytic processing of Stp1 and Stp2 (scissors). The shorter activated forms of Stp1 and Stp2 lacking regulatory domains are targeted to the nucleus where, together with Dal81, they bind SPS-sensor-regulated promoters (UASaa) and induce transcription (Abdel-Sater et al. 2004b; Boban and Ljungdahl 2007). The increased transcription of AAP genes results in increased rates of amino uptake. AAPs are cotranslationally inserted into the ER membrane, which is contiguous with the outer nuclear membrane. Movement of AAPs to the PM (represented by the dashed arrow, right panel) requires the ER membrane-localized chaperone Shr3 (Ljungdahl et al. 1992; Kota and Ljungdahl 2005; Kota et al. 2007). (B) Transporter-based model for Ssy1 amino acid receptor function (Wu et al. 2006). Similar to canonical transporters, Ssy1 can attain four conformational states. However, in contrast to transporters, interconversion between the outward-facing ligand bound state and the inward-facing ligand bound state (reaction 3) is prevented by a ligand-induced reaction barrier. The outward-facing conformations of the Ssy1 sensor are thought to be signaling (green), and the inward-facing conformations are nonsignaling (red). (C) Multistep regulation of the Ssy5 endoprotease. Ssy5 is expressed as an inactive zymogen (left) composed of a prodomain that assists the folding of the Cat domain. Ssy5 is auto-processed when the Cat domain attains an active conformation. The noncovalently attached prodomain remains bound to the Cat domain, forming an inactive but catalytically competent “primed” protease complex. Primed Ssy5 is incorporated as a subcomplex of the SPS sensor via protein–protein interactions involving Ptr3, where it binds, but does not cleave, its substrates Stp1 and Stp2. In the absence of extracellular amino acids, i.e., under non-inducing conditions (left), the basal level of phosphorylation of a phosphodegron in the prodomain is likely to be determined by counteracting activities of casein kinase I (Yck1 and Yck2) and the phosphatase PP2A with its regulatory subunit Rts1 (Eckert-Boulet et al. 2006). In the presence of extracellular amino acids (right), the primary amino acid sensor Ssy1 is stabilized in a conformation that triggers intracellular signaling. This conformation increases the level of phosphorylation of the prodomain phosphodegron (Omnus et al. 2011), presumably by increasing the accessibility of Yck1 or Yck2. An increased level of phosphorylation within the degron provides the requisite surface recognized by the SCFGrr1 complex and subsequent polyubiquitylation of lysine residues of the degron. Concomitant with being ubiquitylated, the prodomain is directly targeted for degradation by the 26S proteasome, unfettering the Stp1 and Stp2 processing activity of the Cat domain.
Figure 12
Figure 12
Membrane transport systems of nitrogenous compounds relevant to amino acid metabolism. Plasma membrane-localized permeases/transporters are shown with their corresponding substrates. The expression of transport proteins in green text is under nitrogen regulation (NCR). The expression of transport proteins in blue text is transcriptionally controlled by the SPS sensor of extracellular amino acids. Transporters thought to be involved in the excretion of amino acids, either functioning in the late secretory pathway or at the plasma membrane, are shown with red outwardly pointing arrows. Transporters localized to intracellular organelle membranes, i.e., mitochondria (M), peroxisome (P), and vacuole (V), are depicted; the arrows indicate the direction of the transport catalyzed.
Figure 13
Figure 13
Pyrimidine synthesis and salvage pathways. DHO, dihydro-orotate; OA, orotic acid; USA, ureidosuccinic acid. Gene names are italicized. Regulatory molecules are shown in red.
Figure 14
Figure 14
Organization of the URA2 and IMD2 promoter regions. The transcription start sites are shown, and their respective distances from the mRNA start site are indicated. Unstable transcripts are shown in gray.
Figure 15
Figure 15
Purine and histidine pathways in yeast. Ado, adenosine; AICAR, 5′-phosphoribosyl-5-amino-4-imidazole carboxamide; Ino, inosine; guo, guanosine; IMP, inosine 5′-monophosphate; PRPP, 5-phosphoribosyl-1-pyrophosphate; SAICAR, 5′-phosphoribosyl-4-(N-succinocarboxamide)-5-amino-imidazole. Gene names are italicized. Regulatory molecules are shown in red.
Figure 16
Figure 16
Regulation of phosphate utilization. The phosphate regulatory cascade is shown. New genes recently identified as important for regulation of phosphate utilization are shown in red. Question marks designate the steps for which no molecular mechanism has been documented yet.

References

    1. Abadjieva A., Hilven P., Pauwels K., Crabeel M., 2000. The yeast ARG7 gene product is autoproteolyzed to two subunit peptides, yielding active ornithine acetyltransferase. J. Biol. Chem. 275: 11361–11367 - PubMed
    1. Abadjieva A., Pauwels K., Hilven P., Crabeel M., 2001. A new yeast metabolon involving at least the two first enzymes of arginine biosynthesis: acetylglutamate synthase activity requires complex formation with acetylglutamate kinase. J. Biol. Chem. 276: 42869–42880 - PubMed
    1. Abdel-Sater F., El Bakkoury M., Urrestarazu A., Vissers S., André B., 2004a Amino acid signaling in yeast: casein kinase I and the Ssy5 endoprotease are key determinants of endoproteolytic activation of the membrane-bound Stp1 transcription factor. Mol. Cell. Biol. 24: 9771–9785 - PMC - PubMed
    1. Abdel-Sater F., Iraqui I., Urrestarazu A., André B., 2004b The external amino acid signaling pathway promotes activation of Stp1 and Uga35/Dal81 transcription factors for induction of the AGP1 gene in Saccharomyces cerevisiae. Genetics 166: 1727–1739 - PMC - PubMed
    1. Abdel-Sater F., Jean C., Merhi A., Vissers S., André B., 2011. Amino-acid signalling in yeast: activation of the Ssy5 protease is associated with its phosphorylation-induced ubiquitylation. J. Biol. Chem. 286: 12006–12015 - PMC - PubMed

Publication types

MeSH terms