. 2012 Jul;5(4):397-408.
doi: 10.1038/mi.2012.17. Epub 2012 Mar 14.

Mucus clearance, MyD88-dependent and MyD88-independent immunity modulate lung susceptibility to spontaneous bacterial infection and inflammation

Affiliations

Mucus clearance, MyD88-dependent and MyD88-independent immunity modulate lung susceptibility to spontaneous bacterial infection and inflammation

A Livraghi-Butrico et al. Mucosal Immunol. 2012 Jul.

Abstract

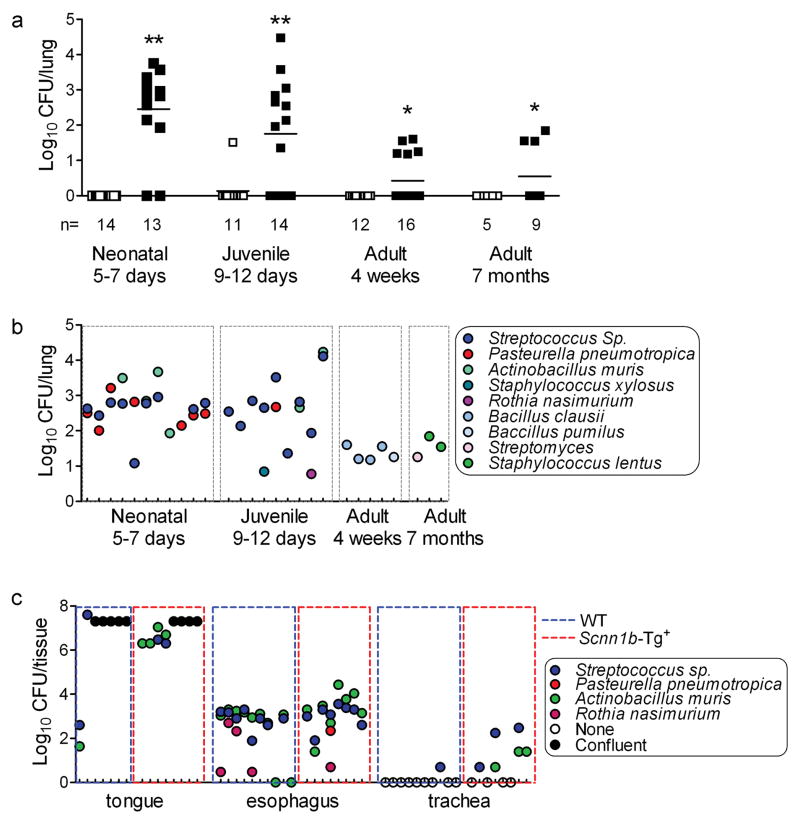
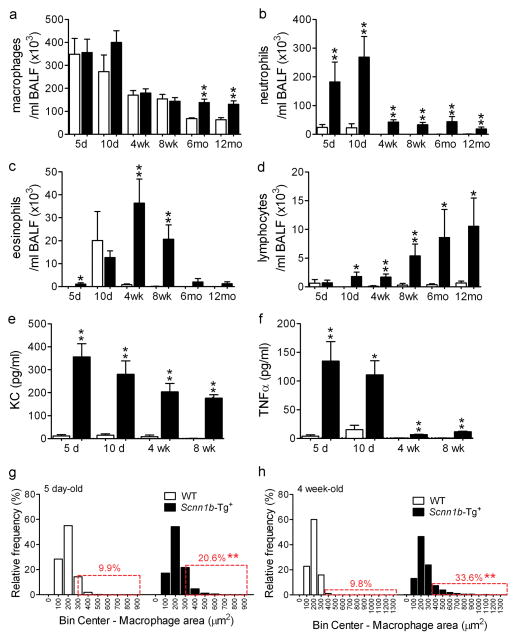
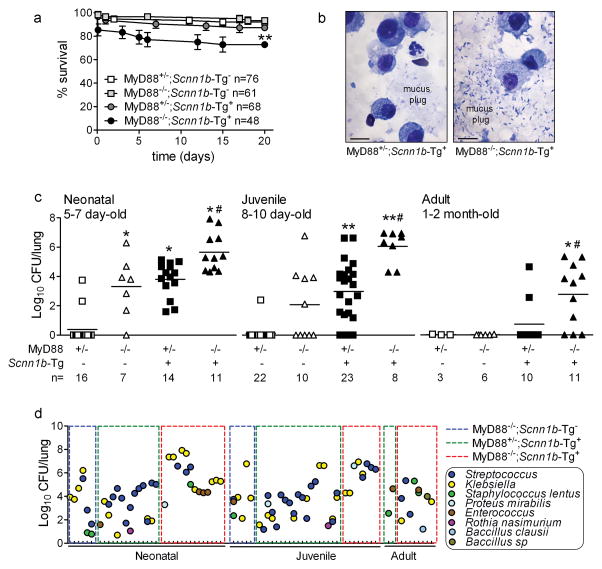
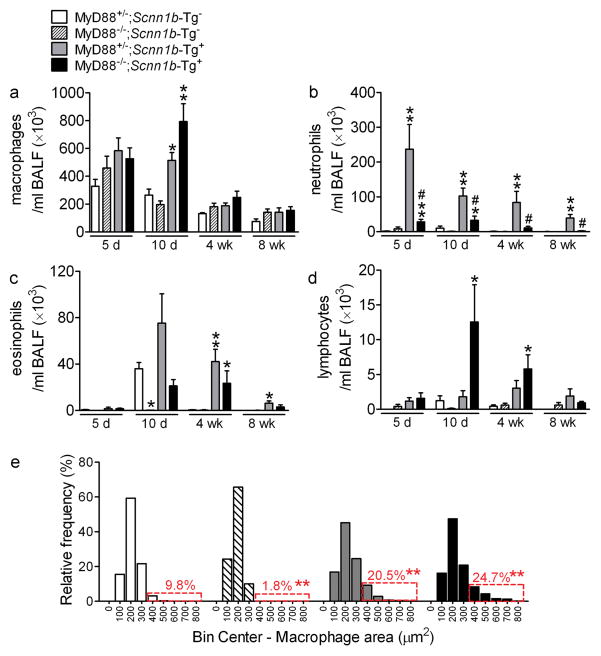
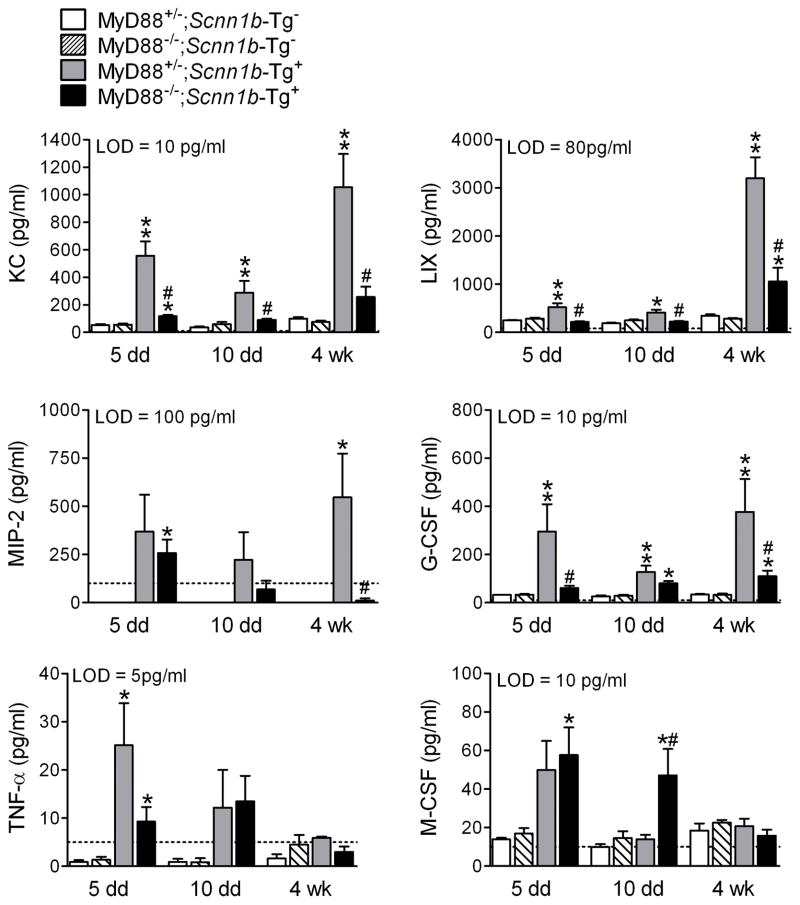
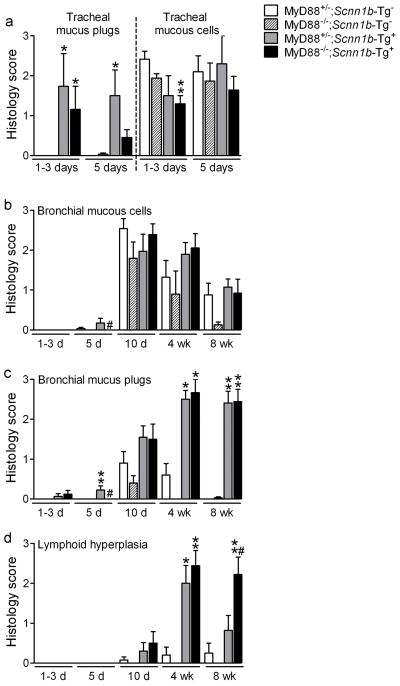
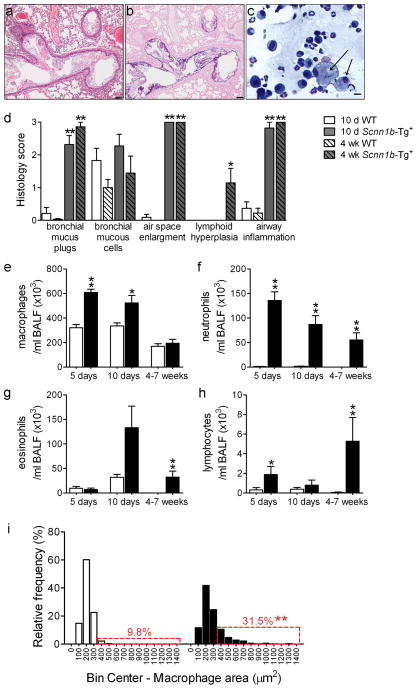
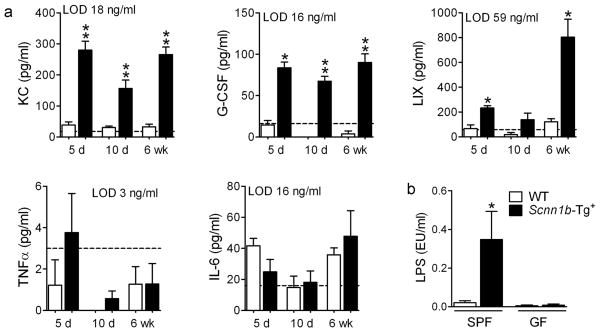
It has been postulated that mucus stasis is central to the pathogenesis of obstructive lung diseases. In Scnn1b-transgenic (Scnn1b-Tg⁺ mice, airway-targeted overexpression of the epithelial Na⁺ channel β subunit causes airway surface dehydration, which results in mucus stasis and inflammation. Bronchoalveolar lavage from neonatal Scnn1b-Tg⁺ mice, but not wild-type littermates, contained increased mucus, bacteria, and neutrophils, which declined with age. Scnn1b-Tg⁺ mice lung bacterial flora included environmental and oropharyngeal species, suggesting inhalation and/or aspiration as routes of entry. Genetic deletion of the Toll-interleukin-1 receptor adapter molecule MyD88 in Scnn1b-Tg⁺ mice did not modify airway mucus obstruction, but caused defective neutrophil recruitment and increased bacterial infection, which persisted into adulthood. Scnn1b-Tg⁺ mice derived into germ-free conditions exhibited mucus obstruction similar to conventional Scnn1b-Tg⁺ mice and sterile inflammation. Collectively, these data suggest that dehydration-induced mucus stasis promotes infection, compounds defects in other immune mechanisms, and alone is sufficient to trigger airway inflammation.


Conflict of interest statement

Conflict of interest: The authors have no conflicting financial interests.

Figures

Figure 1
Figure 1. Spontaneous bacterial colonization in C57BL/6N Scnn1b-Tg+ mice
(a) Timecourse analysis of total colony forming units (CFU) in BAL samples from Scnn1b-Tg+ mice (■) and WT littermates (□). (Log10+1)-transformed data. n= number of mice/group. T test ** p<0.005, * p<0.05 vs. WT littermates. (b) Individual CFUs and bacterial species isolated from C57BL/6N Scnn1b-Tg+ mice. Each tick on the x axis represents an individual mouse. (c) Bacteria isolated from tongue, esophagus, trachea, and lung tissue homogenates of PND 5 C57BL/6N Scnn1b-Tg+ mice and WT littermates. (Log10+1)-transformed data. Each tick on the x axis represents an individual mouse. CFUs in confluent plates could not be enumerated and were arbitrarily set at 2×10⁷ CFU/tissue.
Figure 2
Figure 2. Developmental profile of lung inflammation in C57BL/6N Scnn1b-Tg+ mice
(a-d). Longitudinal BAL cell counts in Scnn1b-Tg+ mice (■) and WT littermates (□). n= 6 and 8 at 5 days (5d); n= 7 and 12 at 10 days (10d); n=12 and 13 at 4 weeks (4wk); n=10 and 8 at 8 weeks (8wk); n=4 and 4 at 6 months (6mo); n=14 and 6 at 12 months (12mo), for WT and Scnn1b-Tg+, respectively. (e-f) Longitudinal KC and TNFα levels in BAL fluid. n= 4 WT and 6 Scnn1b-Tg+ mice. T test ** p<0.005, * p<0.05 vs. WT littermates. (g–h) Macrophage size distribution in 5 day and 4 week-old C57BL/6N Scnn1b-Tg+ mice and WT littermates. n= 6 WT and 8 Scnn1b-Tg+ mice at PND 5; 10 WT and 13 Scnn1b-Tg+ mice at PND 28. Boxed regions highlight the percentage of total macrophages larger than the 90th percentile in WT mice. T test ** p<0.005, * p<0.05 vs. WT littermates.
Figure 3
Figure 3. Genetic deletion of MyD88 decreases neonatal survival and increases lung bacterial burden in WT and Scnn1b-Tg+ mice
(a) Survival curves. Absence of MyD88 in Scnn1b-Tg+ mice lowers survival. ANOVA * p = 0.004 vs. littermates. (b) Representative photomicrograph of BAL cytospin preparations from neonatal MyD88-sufficient and -deficient Scnn1b-Tg+ mice, illustrating mucus-associated bacteria in MyD88−/−;Scnn1b-Tg+ mice. Scale bar = 10 μm. (c) Bacterial CFU in mice from the MyD88−/− × Scnn1b-Tg+ cross at the ages indicated, (Log10+1)-transformed data. n= number of mice/group. ANOVA ** p<0.005, * p<0.05 vs. MyD88+/−;Scnn1b-Tg mice. # p<0.05 vs. MyD88+/−;Scnn1b-Tg+ mice. (d) Lung microflora in mice from the MyD88−/− × Scnn1b-Tg+ cross. Each tick on the x axis represents an individual mouse.
Figure 4
Figure 4. Genetic deletion of MyD88 reduces lung neutrophilia in Scnn1b-Tg+ mice, but does not blunt macrophage activation
(a–d) Differential BAL cell counts. n= 8, 9, 8, 8 at 5 days (5d), n= 14, 9, 12, 12 at 10 days (10d), n= 5, 5, 5, 9 at 4 weeks (4wk), and n= 3, 6, 7, 8 at 8 weeks (8wk) for MyD88+/−;Scnn1b-Tg-, MyD88−/−;Scnn1b-Tg-, MyD88+/−;Scnn1b-Tg+, and MyD88−/−;Scnn1b-Tg+ mice, respectively. ANOVA ** p<0.005, * p<0.05 vs. MyD88+/−;Scnn1b-Tg mice. # p<0.05 vs. MyD88+/−;Scnn1b-Tg+ mice. (e) Macrophage size distribution in 4 week-old mice from the MyD88−/− × Scnn1b-Tg+ cross. Boxed regions highlight the percentage of total macrophages larger than the 90th percentile in MyD88+/−;Scnn1b-Tg mice. n=5 MyD88+/−;Scnn1b-Tg-, 4 MyD88−/−;Scnn1b-Tg-, 5 MyD88+/−;Scnn1b-Tg+, and 8 MyD88−/−;Scnn1b-Tg+. ANOVA ** p<0.005, * p<0.05 vs. MyD88+/−;Scnn1b-Tg-littermates.
Figure 5
Figure 5. MyD88 deletion in Scnn1b-Tg+ mice alters BAL neutrophil- and macrophage-related inflammatory mediators
BAL cytokines in 5 day-, 10 day- and 4 week-old mice. The dotted line represents the assay lower detection limit (LOD). n = 4 for WT mice and n=6 for Scnn1b-Tg+ mice. ANOVA ** p<0.005, * p<0.05 vs. age-matched MyD88+/−;Scnn1b-Tg mice. # p<0.05 vs. MyD88+/−;Scnn1b-Tg+ mice.
Figure 6
Figure 6. MyD88 deletion does not modify mucus plugging, but promotes development of lymphoid aggregates in Scnn1b-Tg+ mice
(a-c)Semi-quantitative histopathology scores for mucus plugs and mucous secretory cells (AB-PAS positive) in (a) neonatal trachea and (b-c) left lobe intrapulmonary main stem bronchus, at different time points. (d) Semi-quantitative histopathology scores for lymphoid aggregates (BALT). n= 6, 8, 3, 5 at 1–3 days (1–3d), n= 5, 6, 4, 8 at 5 days (5d), n= 13, 5, 10, 12 at 10 days (10d), n= 5, 4, 5, 9 at 4 weeks (4wk), and n= 8, 8, 11, 9 at 8 weeks (8wk) for MyD88+/−;Scnn1b-Tg-; MyD88−/−;Scnn1b-Tg-; MyD88+/−;Scnn1b-Tg+; and MyD88−/−;Scnn1b-Tg+ mice, respectively. ANOVA ** p<0.005, * p<0.05 vs. MyD88+/−;Scnn1b-Tg mice. # p<0.05 vs. MyD88+/−;Scnn1b-Tg+ mice.
Figure 7
Figure 7. Germ-free (GF) Scnn1b-Tg+ mice develop lung inflammation similar to Scnn1b-Tg+ mice raised in conventional SPF conditions
(a, b) Representative photomicrographs of left lobe main stem bronchus from 6 week-old GF Scnn1b-Tg+ mice, illustrating alveolar space enlargement, mucus obstruction, and airway inflammation. H&E (a) and AB-PAS (b) stain. Scale bar 100 μm. (c) Representative photomicrograph of BAL cytospin preparation from GF Scnn1b-Tg+ mice, illustrating mucus plugs (light blue), granulocytes and large/foamy macrophages (arrows). Giemsa stain, scale bar = 20 μm. (d) Semi-quantitative histopathology scores for 10 day old (10 d, open bars) and 4 week-old (4 wk, hatched bars) Scnn1b-Tg+ mice (gray) and WT littermates (white) raised in GF conditions, n= 11 Scnn1b-Tg+ and 11 WT littermates at 10 days, n=7 Scnn1b-Tg+ and 9 WT littermates at 4 weeks of age. T test ** p<0.005, * p<0.05 vs. WT littermates. (e-h) Longitudinal differential BAL cell counts for GF Scnn1b-Tg+ mice (■) and WT littermates (□). n= 11 and 11 at 5 days, n= 18 and 8 at 10 days, n= 8 and 7 at 4–7 weeks, for GF WT and GF Scnn1b-Tg+ mice, respectively. (i) Macrophage size distribution in 4–7 week-old GF Scnn1b-Tg+ mice (■, n=7) and WT littermates (□, n=8). Boxed regions highlight the percentage of total macrophages larger than the 90th percentile in WT mice. T test ** p<0.005 vs. WT littermates.
Figure 8
Figure 8. BAL cytokine profile and BAL LPS content in germ-free Scnn1b-Tg+ mice and WT littermates
(a) BAL cytokines in 5 day-, 10 day- and 6 week-old mice. The dotted line represents the assay lower detection limit (LOD). n = 6 for WT and 8 for Scnn1b-Tg+ mice. ANOVA ** p<0.005, * p<0.05 vs. WT littermates. (b) LPS content in BAL isolated from SPF or GF Scnn1b-Tg+ mice (■) and WT littermates (□). n= 14 and 11 for SPF WT and Scnn1b-Tg+ mice, respectively; n= 4 and 5 for GF WT and Scnn1b-Tg+ mice, respectively. T test * p<0.05 vs. WT littermates.

References

    1. Randell SH, Boucher RC. Effective mucus clearance is essential for respiratory health. Am J Respir Cell Mol Biol. 2006;35:20–8. - PMC - PubMed
    1. Mall M, Grubb BR, Harkema JR, O’Neal WK, Boucher RC. Increased airway epithelial Na+ absorption produces cystic fibrosis-like lung disease in mice. Nat Med. 2004;10:487–93. - PubMed
    1. Mall MA, et al. Development of chronic bronchitis and emphysema in beta-epithelial Na+ channel-overexpressing mice. Am J Respir Crit Care Med. 2008;177:730–42. - PMC - PubMed
    1. Hauser AR, Jain M, Bar-Meir M, McColley SA. Clinical significance of microbial infection and adaptation in cystic fibrosis. Clin Microbiol Rev. 2011;24:29–70. - PMC - PubMed
    1. Sethi S. Infection as a comorbidity of COPD. Eur Respir J. 2010;35:1209–15. - PubMed

Publication types

Substances