

Choice-specific sequences in parietal cortex during a virtual-navigation decision task
- PMID: 22419153
- PMCID: PMC3321074
- DOI: 10.1038/nature10918
Choice-specific sequences in parietal cortex during a virtual-navigation decision task
Abstract
The posterior parietal cortex (PPC) has an important role in many cognitive behaviours; however, the neural circuit dynamics underlying PPC function are not well understood. Here we optically imaged the spatial and temporal activity patterns of neuronal populations in mice performing a PPC-dependent task that combined a perceptual decision and memory-guided navigation in a virtual environment. Individual neurons had transient activation staggered relative to one another in time, forming a sequence of neuronal activation spanning the entire length of a task trial. Distinct sequences of neurons were triggered on trials with opposite behavioural choices and defined divergent, choice-specific trajectories through a state space of neuronal population activity. Cells participating in the different sequences and at distinct time points in the task were anatomically intermixed over microcircuit length scales (<100 micrometres). During working memory decision tasks, the PPC may therefore perform computations through sequence-based circuit dynamics, rather than long-lived stable states, implemented using anatomically intermingled microcircuits.
Figures
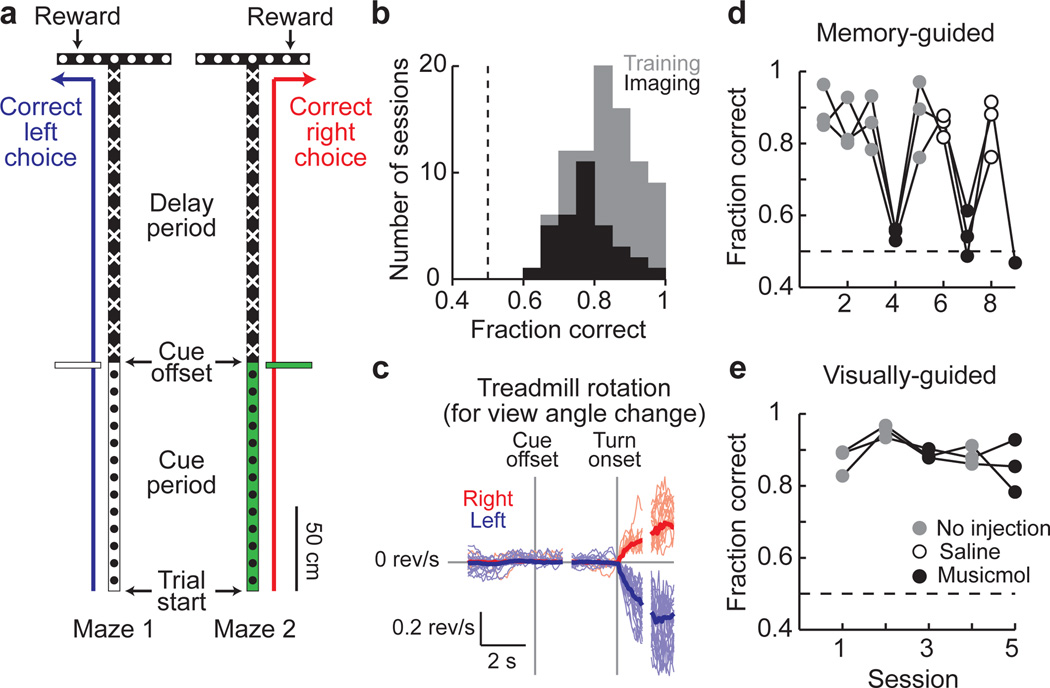
Schematic of the two versions of the virtual T-maze that differed only in the cue period and the reward location. Patterns in the schematic reflect the patterns present on the virtual maze walls.
Behavioral performance on individual training (gray) and imaging (black) sessions.
Rotational velocity of the spherical treadmill about the vertical axis for view angle changes on correct right (red) and left (blue) trials, aligned to the cue offset and the turn onset.
Behavioral performance on a memory-guided task from (a) after receiving no injections (gray), saline (open circles), or muscimol (black) bilaterally in the PPC. Connected dots are from individual mice across daily sessions (n = 3 mice).
Same as in (d) except for a visually-guided task (Supplementary Fig. 1b).
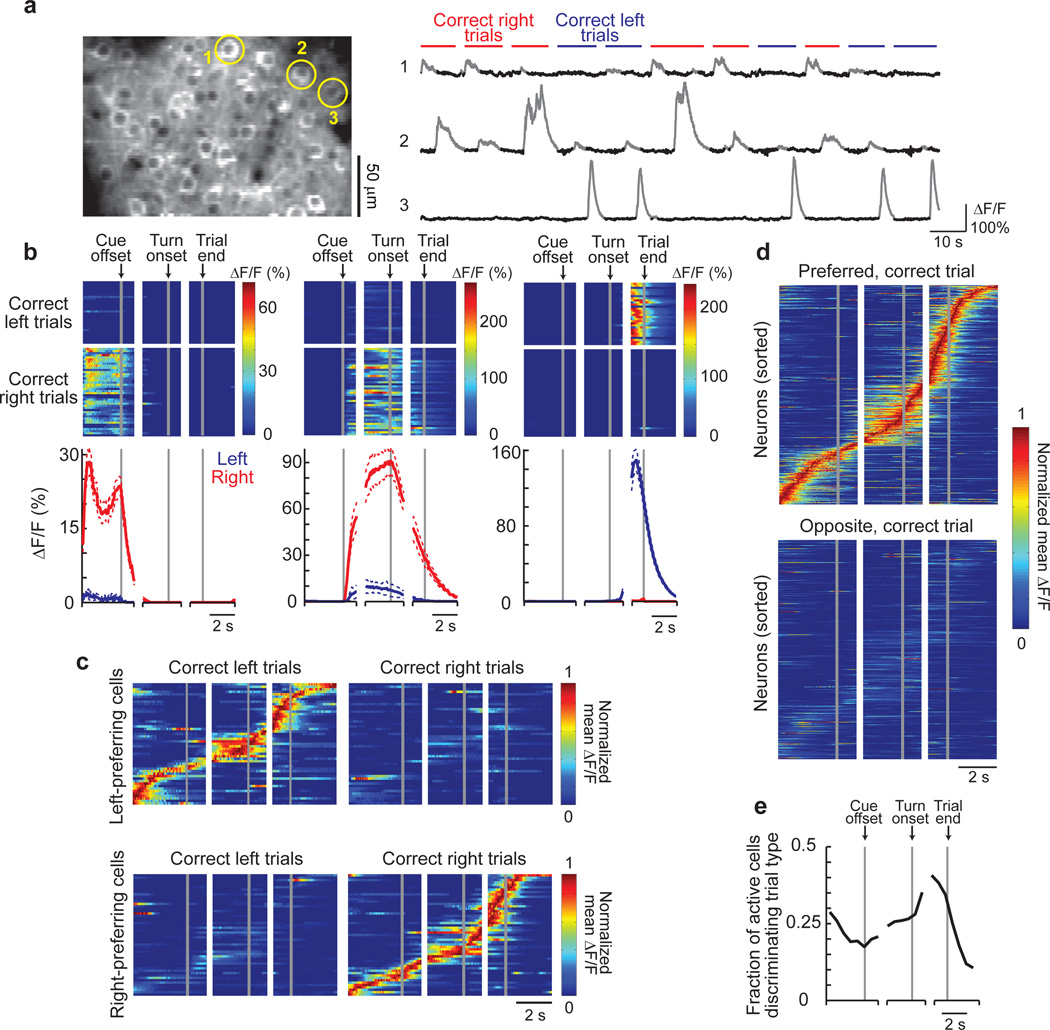
Left: Example image of GCaMP3-expressing neurons in layer 2/3. Right: Example fluorescence intensity traces (ΔF/F; gray portions indicate significant Ca2+ transients, Methods) for three example cells from the left panel on correct right (red) and left (blue) trials.
Activity patterns during the task for cells 1–3 from (a). Top: Color-coded ΔF/F traces for individual correct left and right choice trials. Each row is a single trial aligned to the cue offset, turn onset, and trial end. Bottom: Mean ΔF/F traces for correct right (red) and left (blue) choice trials. Dashed lines indicate mean ± sem.
Normalized mean ΔF/F traces for all the choice-specific, task-modulated cells (one cell per row) imaged in a single mouse and divided by left-preferring (n = 51) and right-preferring (n = 54) cells. Traces were normalized to the peak of each cell’s mean ΔF/F trace on preferred trials and sorted by the peak time. Some cells were imaged on different days and in different fields-of-view.
Same as in (c), except for all mice (n = 404 cells from 6 mice) on preferred and opposite trials.
Fraction of active cells with significantly different activity levels on right and left choice trials as a function of trial time.
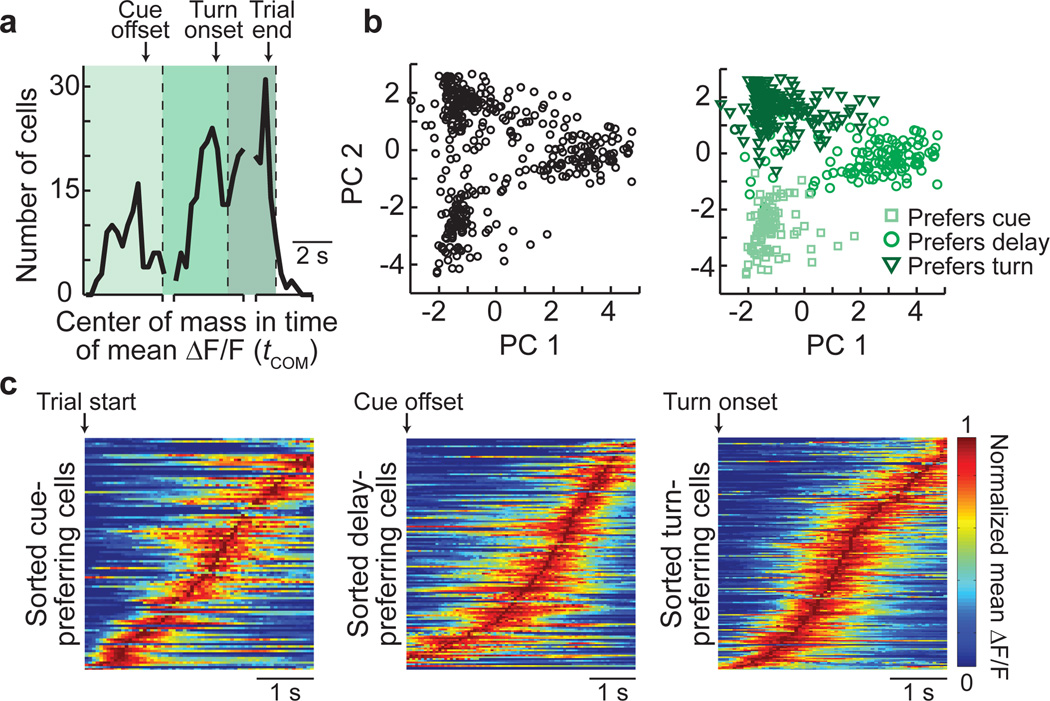
Histogram of the times of the center-of-mass of the mean ΔF/F trace (tCOM) for choice-specific, task-modulated cells. Cells were separated into three groups (cue-, delay-, and turn-preferring cells; varying shades of green) based on peaks in the distribution.
PCA on the normalized mean ΔF/F traces for all the choice-specific, task-modulated cells. Left: Scores for each cell plotted for the first two principal components. Right: Cells categorized based on the groupings from (a). n = 404 cells.
Sorted normalized mean ΔF/F traces for cue-preferring (n = 101), delay-preferring (n = 133), and turn-preferring (n = 170) cells, aligned to the trial start, cue offset, and turn onset, respectively, on the preferred trial-type.

Time course of mean choice-specific trajectories on correct right (red) and left (blue) choice trials from one session (plotted for the first three common factors). Points labeled 1, 2, 3 correspond to the mean times of the cue offset, turn onset, and trial end, respectively.
Example individual (thin lines) and mean (thick lines) trajectories for correct trials from the session in (a).
Euclidean distance between the mean trajectories on correct right and left choice trials (n = 29 individual sessions, gray). The black line indicates the mean.
Trajectory selectivity index for individual correct trials from a single session, defined based on distances as (dto mean traj, opposite choice – dto mean traj, same choice)/(dto mean traj, same choice + dto mean traj, opposite choice). Values close to 1 and -1 indicate that the individual trial trajectory was near the mean trajectory of the same and opposite behavioral choice, respectively. Mean trajectories were defined using correct trials only. Gray and black lines indicate individual trials and the mean, respectively.
Classification accuracy for determining the behavioral choice of the mouse at different time points in the task during individual sessions (gray, n = 29; black, mean). The classifier was based on a distance-dependent classification scheme (see Methods) using correct trials.
Example individual trial trajectories (gray and black) on right choice and left choice errors trials, plotted with the mean trajectories for correct right (red) and left (blue) choice trials.
Same as for (d), except on error trials.
Same as for (e), except on error trials.
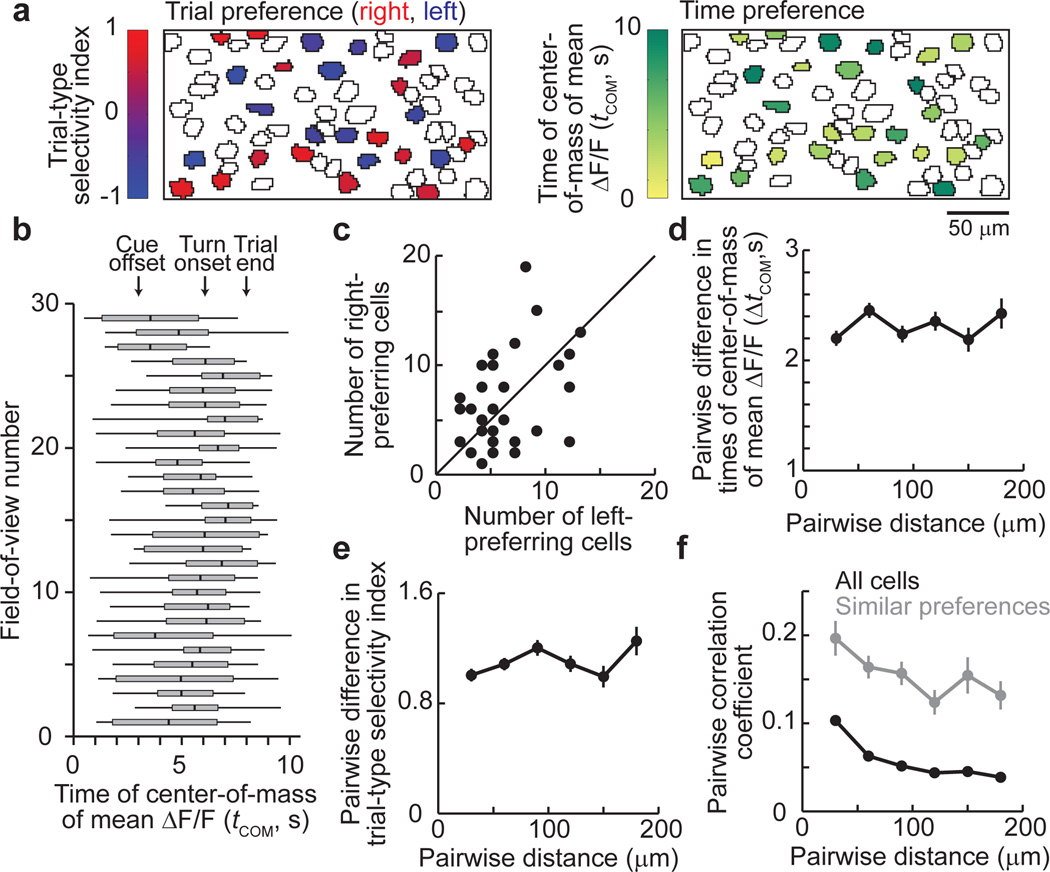
Example field-of-view with cells outlined and choice-specific, task-modulated cells colored. Top: Cells’ trial-type selectivity, defined as (ΔF/Fright trials − ΔF/Fleft trials) / (ΔF/Fright trials + ΔF/Fleft trials). Values close to 1 (red) and -1 (blue) indicate right and left choice preferences, respectively. Bottom: Cells’ time of the center-of-mass of the mean ΔF/F trace (tCOM). tCOM = 0 corresponds to ~3 s before the cue offset.
Box plots of tCOM values for task-modulated cells in individual fields-of-view (box edges, first and third quartiles; vertical line in the box, median; whiskers, range)
Number of right and left choice-preferring cells in each field-of-view (n = 29; unity line is shown).
Difference in tCOM as a function of the distance between cells.
Difference in the trial-type selectivity index as a function of the distance between cells.
Pearson’s correlation between non-averaged ΔF/F traces (all time points) for all pairs of active cells (black) and cell pairs with the same trial-type and behavioral period preference (gray) as a function of the cell-cell distance.
Comment in
-
Neuroscience: The symphony of choice.Nature. 2012 Apr 4;484(7392):42-3. doi: 10.1038/484042a. Nature. 2012. PMID: 22481352 No abstract available.
References
-
- Shadlen MN, Newsome WT. Neural basis of a perceptual decision in the parietal cortex (area LIP) of the rhesus monkey. J Neurophysiol. 2001;86:1916–1936. - PubMed
-
- Gold JI, Shadlen MN. The neural basis of decision making. Annu Rev Neurosci. 2007;30:535–574. - PubMed
-
- Freedman DJ, Assad JA. A proposed common neural mechanism for categorization and perceptual decisions. Nat Neurosci. 2011;14:143–146. - PubMed
-
- Andersen RA, Cui H. Intention, action planning, and decision making in parietal-frontal circuits. Neuron. 2009;63:568–583. - PubMed
Publication types
MeSH terms
Grants and funding
LinkOut - more resources
Full Text Sources
Other Literature Sources
Medical
