

Analysis of molecular cytogenetic alterations in uterine leiomyosarcoma by array-based comparative genomic hybridization
- PMID: 22419440
- PMCID: PMC11824731
- DOI: 10.1007/s00432-012-1182-6
Analysis of molecular cytogenetic alterations in uterine leiomyosarcoma by array-based comparative genomic hybridization
Abstract
Objective: The aim of this study was to identify novel genes following genomic DNA copy number changes using a genome-wide array-based comparative genomic hybridization (array-CGH) analysis in uterine leiomyosarcoma (ULMS).
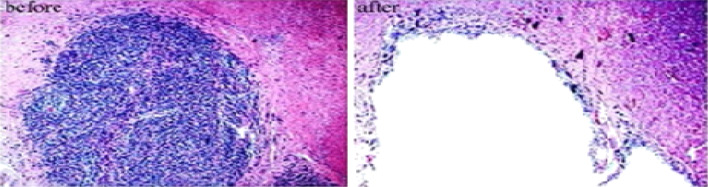
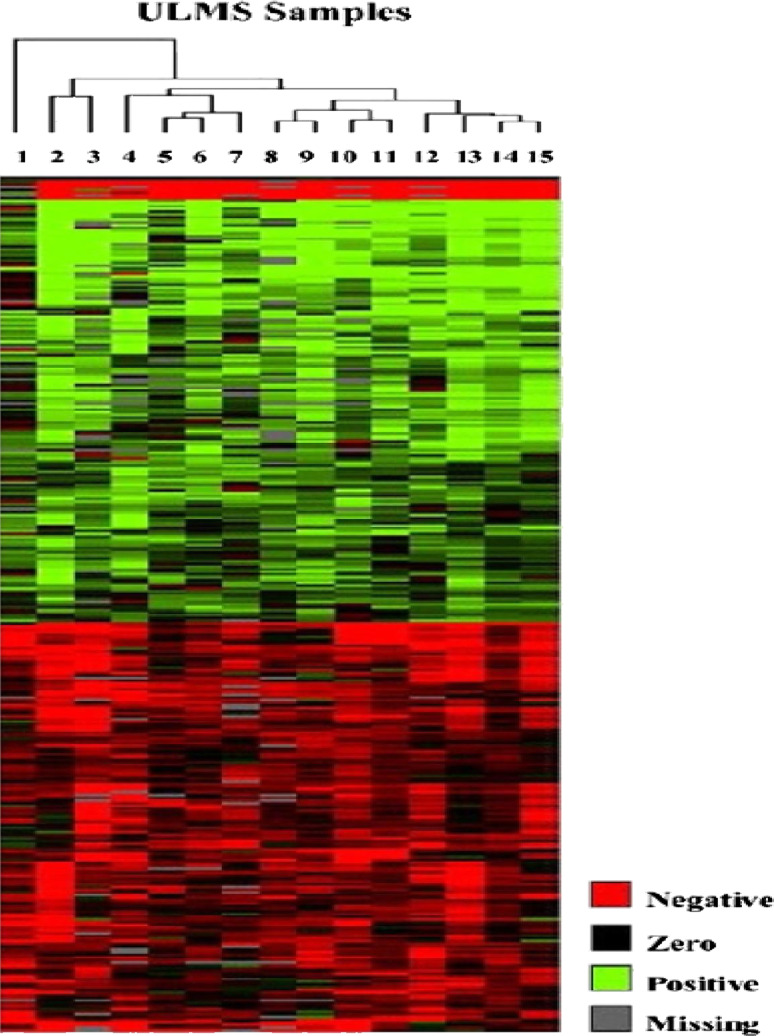
Methods: Genomic DNA copy number changes were analyzed in 15 cases of ULMS from St Mary's Hospital of the Catholic University of Korea. The paraffin-fixed tissue samples were micro-dissected under microscope, and DNA was extracted. Array-based CGH and genomic polymerase chain reaction were carried out with statistical analyses such as hierarchical clustering and Gene Ontology.
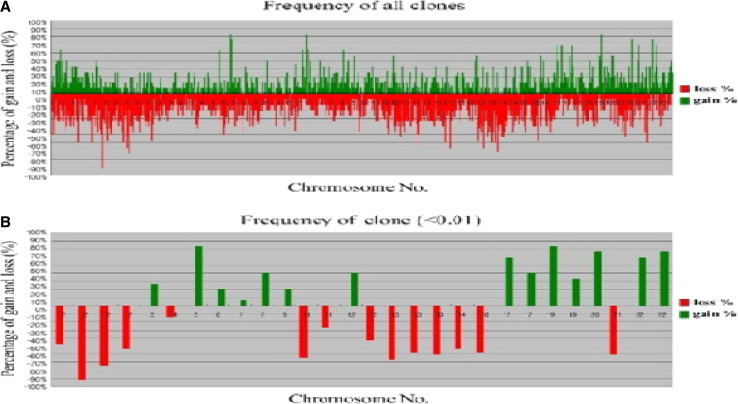
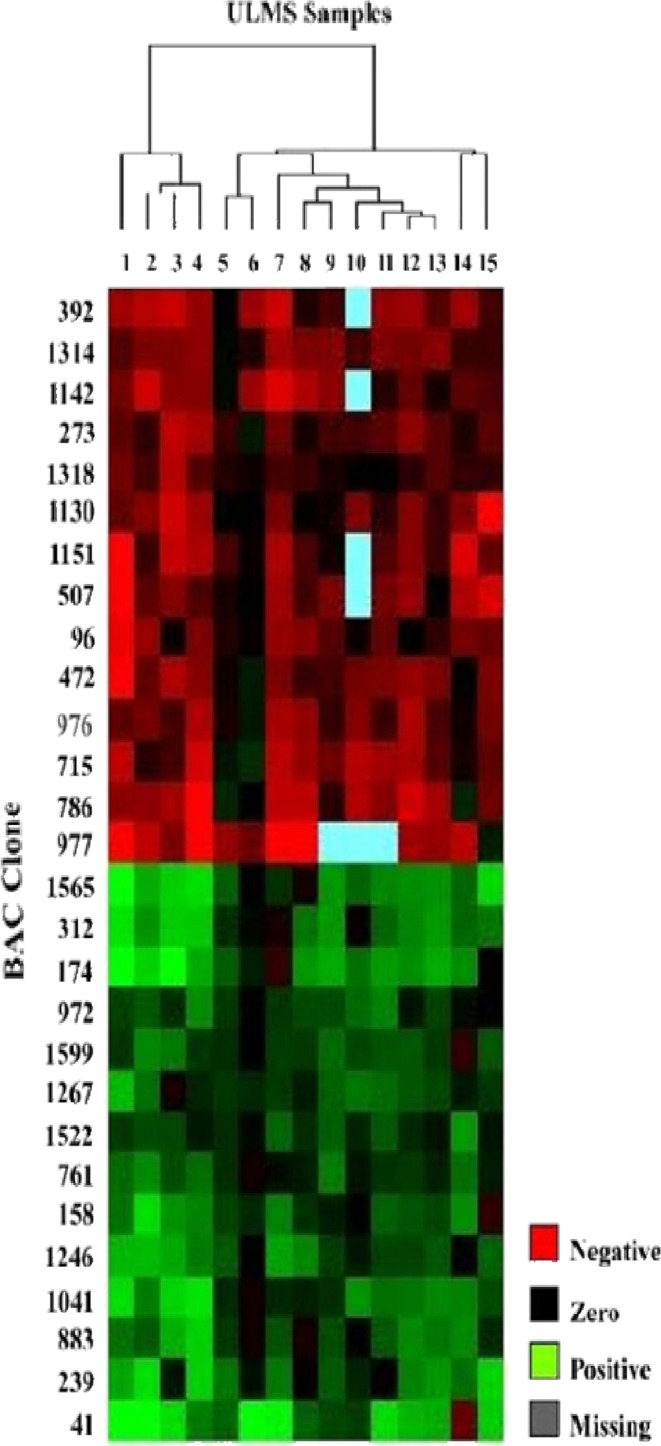
Results: All of 15 cases of ULMS showed specific gains and losses. The percentage of average gains and losses were 8.4 and 16.6 %, respectively. The analysis limit of average gains and losses was 40 %. The regions of high level of gain were 1q23.3, 7p14.2, 7q34, 7q35, 7q36.3, 13q34, and 16p13.3. And the regions of homozygous loss were 2q21.1, 2q22.1, 2p23.2, 12q23.3, 4q21.22, 4q34.3, 11q24.2, 12q23.3, 13q13.1, 13q21.33, and 14q24.3. In ULMS samples, recurrent regions of gain were 1p36.33, 1p36.32, 5q35.3, 7q36.3, and 8q24.3 and recurrent regions of loss were 1p31.1-p31.3, 1p32.1-p32.3, 2p12, 2p13.3, 2p14, 2p16.2-p16.3, 2q12.1-q12.3, 2q21.1-q21.2, 2q22.2-q22.3, 2q34, 2q36.1-q36.3, 5q21.3, 5q23.3, 5q31.1, 6p11.2, 6p12.1, 10q11.23, 10q21.2-q21.3, 10q23.2, 10q23.31, 10q25.1-q25.2, 10q25.3, 10q26.13, 10q26.2-q26.3, 11p11.2, 11p11.12, 11p12, 11p13, 11p15.4, 11q23.1-q23.2, 11q23.3, 13q14.12, 13q14.13-13q14.2, 13q14.2, 13q14.2, 13q14.3, 13q21.33, 13q22.1-q22.3, 14q24.2, 14q24.3, 14q31.1, 14q32.33, 15q11.2-q13, 15q14, 16q22.3, 16q23.1, 16q23.2, 16q24.1, 20p12.1, and 21q22.3. Representative frequently gained BAC clones encoded genes were HDAC9, CRR9, SOX18, PTPRN2, SKI, SOLH, and KIAA1199. The genes encoded by frequently lost BAC clones were LOC150516 and AMY2A. A subset of cellular processes from each gene were clustered by Gene Ontology database.
Conclusions: The present study using array-CGH analyses sought a deeper elucidation of the specific genomic alterations related to ULMS. The high resolution of array-CGH combined with human genome database would give a chance at identifying relevant target genes.
Figures
References
-
- Albertson DG, Ylstra B, Segraves R, Collins C, Dairkee SH, Kowbel D, Kuo WL, Gray JW, Pinkel D (2000) Quantitative mapping of amplicon structure by array CGH identifies CYP24 as a candidate oncogene. Nat Genet 25:144–146 - PubMed
-
- Ashar HR, Fejzo MS, Tkachenko A, Zhou X, Fletcher JA, Weremowicz S, Morton CC, Chada K (1995) Disruption of the architectural factor HMGI-C: DNA-binding AT hook motifs fused in lipomas to distinct transcriptional regulatory domains. Cell 82:57–65 - PubMed
-
- Barbieri RL, Andersen JA (1992) Uterine leiomyomas: the somatic mutation theory. Semin Reprod Endocrinol 10:301–309
-
- Boghosian L, Dal Cin P, Turc-Carel C, Rao U, Karakousis C, Sait SJ, Sandberg AA (1989) Three possible cytogenetic subgroups of leiomyosarcoma. Cancer Genet Cytogenet 43:39–49 - PubMed
-
- Cho YL, Bae S, Koo MS, Kim KM, Chun HJ, Kim CK, Ro DY, Kim JH, Lee CH, Kim YW, Ahn WS (2005) Array comparative genomic hybridization analysis of uterine leiomyosarcoma. Gynecol Oncol 99:545–551 - PubMed
MeSH terms
LinkOut - more resources
Full Text Sources
Other Literature Sources
Medical
Research Materials
Miscellaneous
