. 2012 May 15;72(10):2533-42.
doi: 10.1158/0008-5472.CAN-11-3317. Epub 2012 Mar 14.

Hepatocyte-stellate cell cross-talk in the liver engenders a permissive inflammatory microenvironment that drives progression in hepatocellular carcinoma

Affiliations

Hepatocyte-stellate cell cross-talk in the liver engenders a permissive inflammatory microenvironment that drives progression in hepatocellular carcinoma

Cédric Coulouarn et al. Cancer Res. .

Abstract

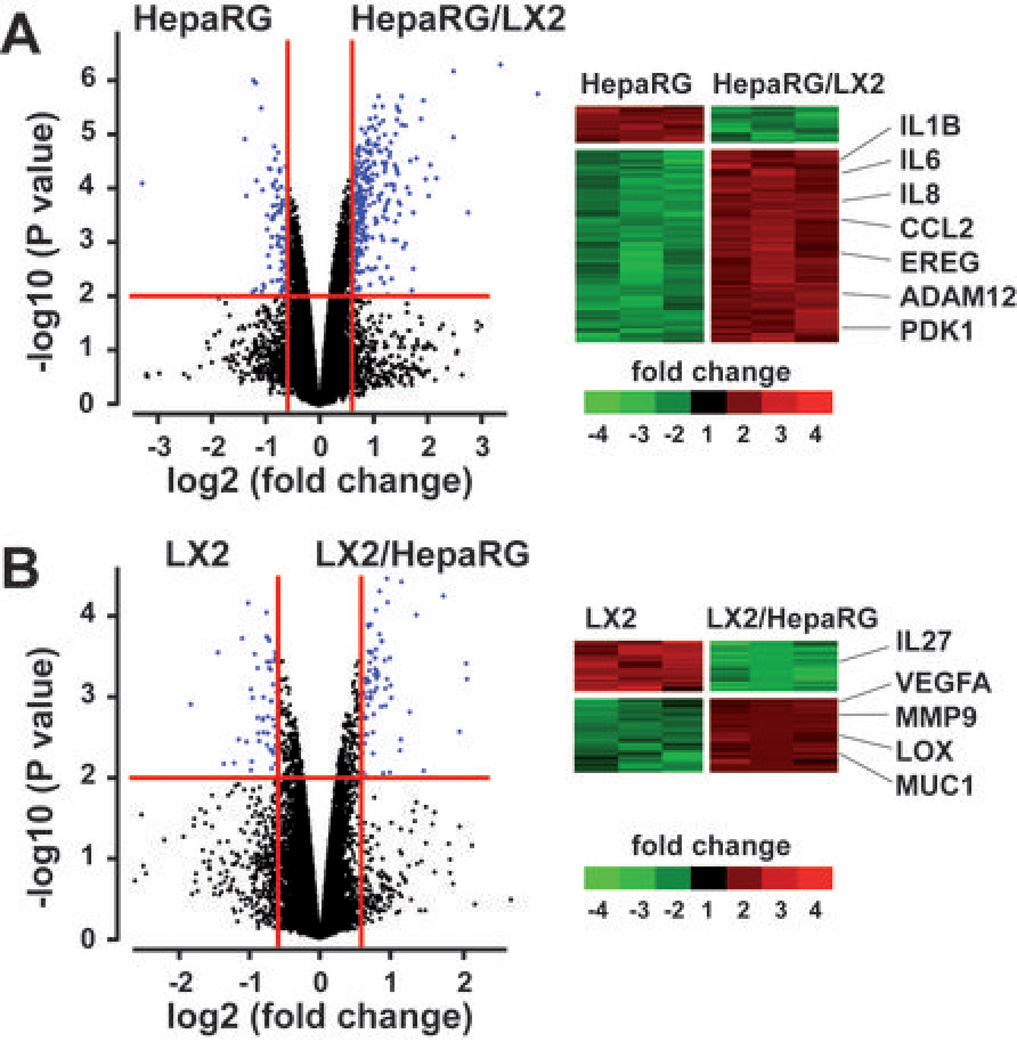
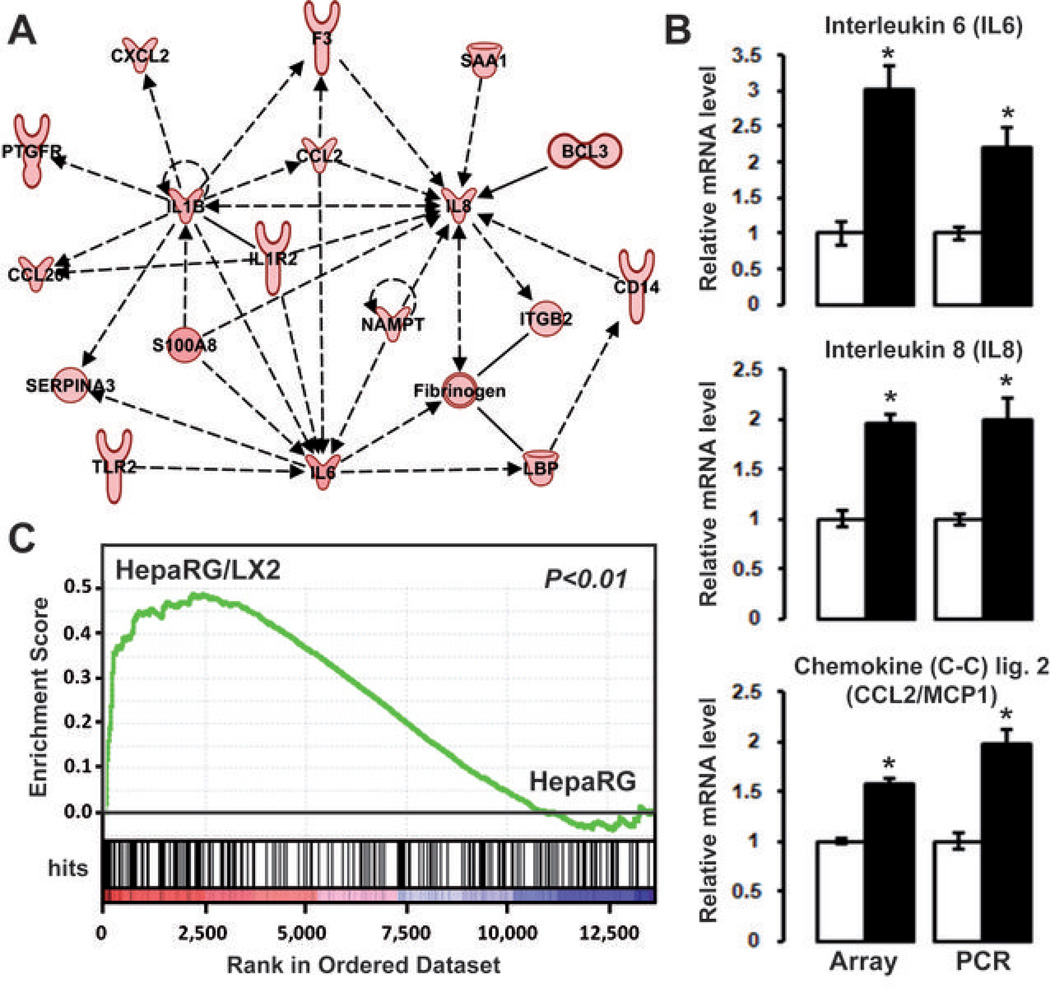
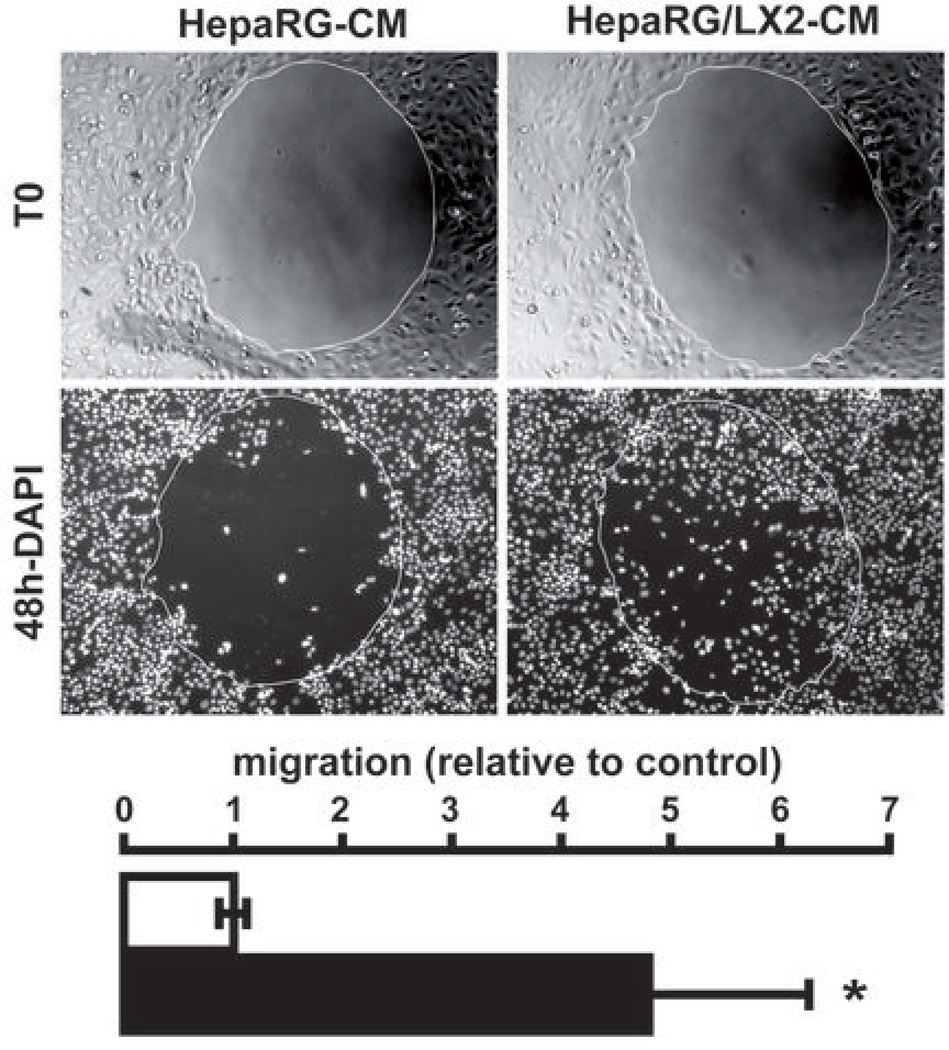
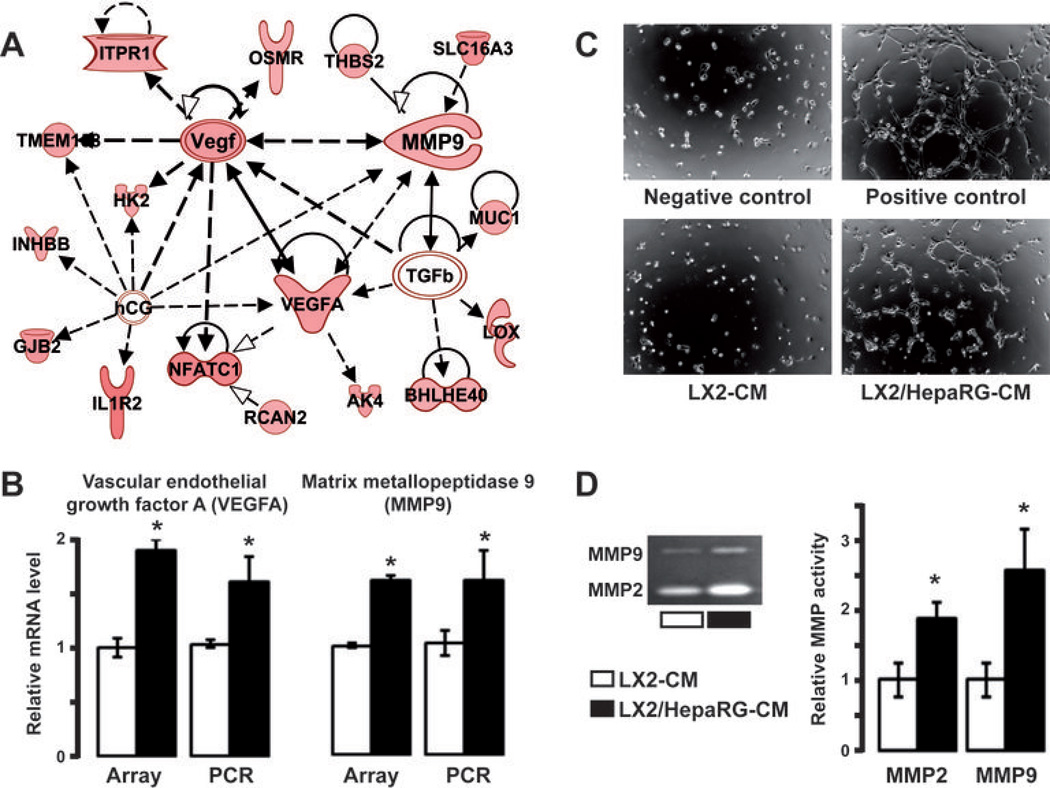
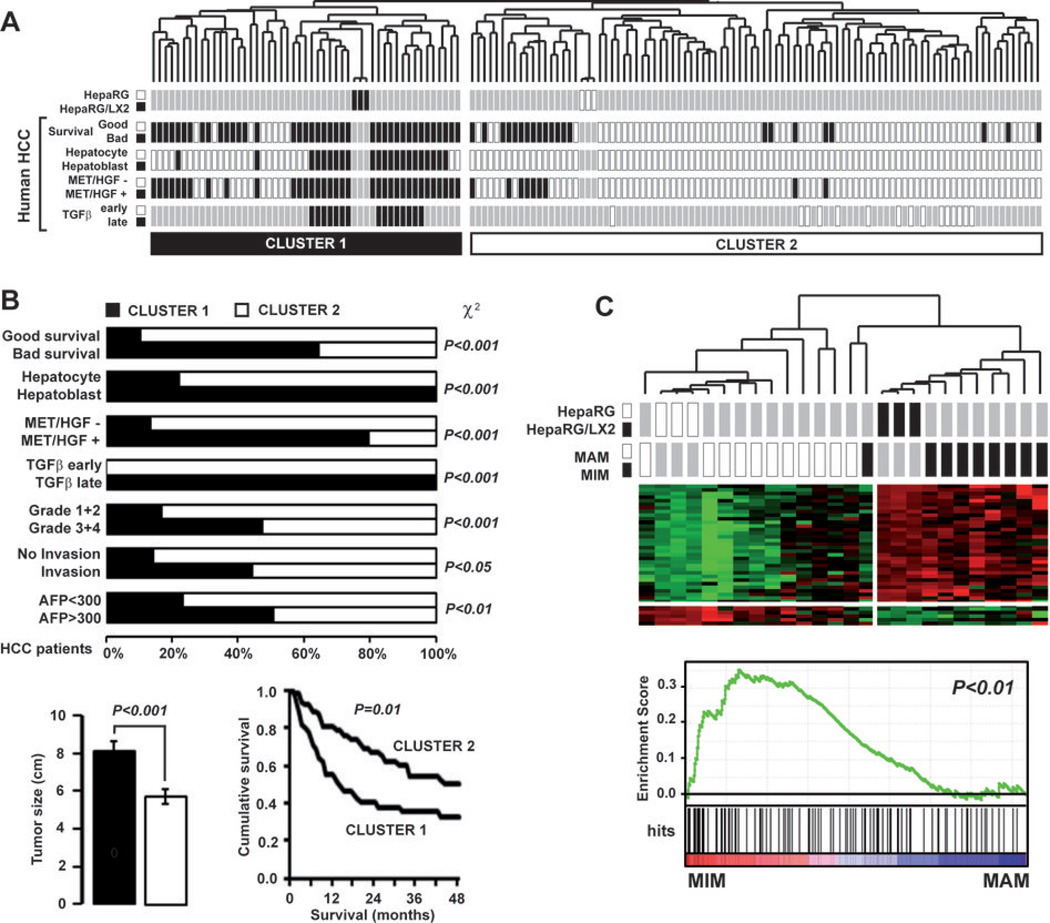
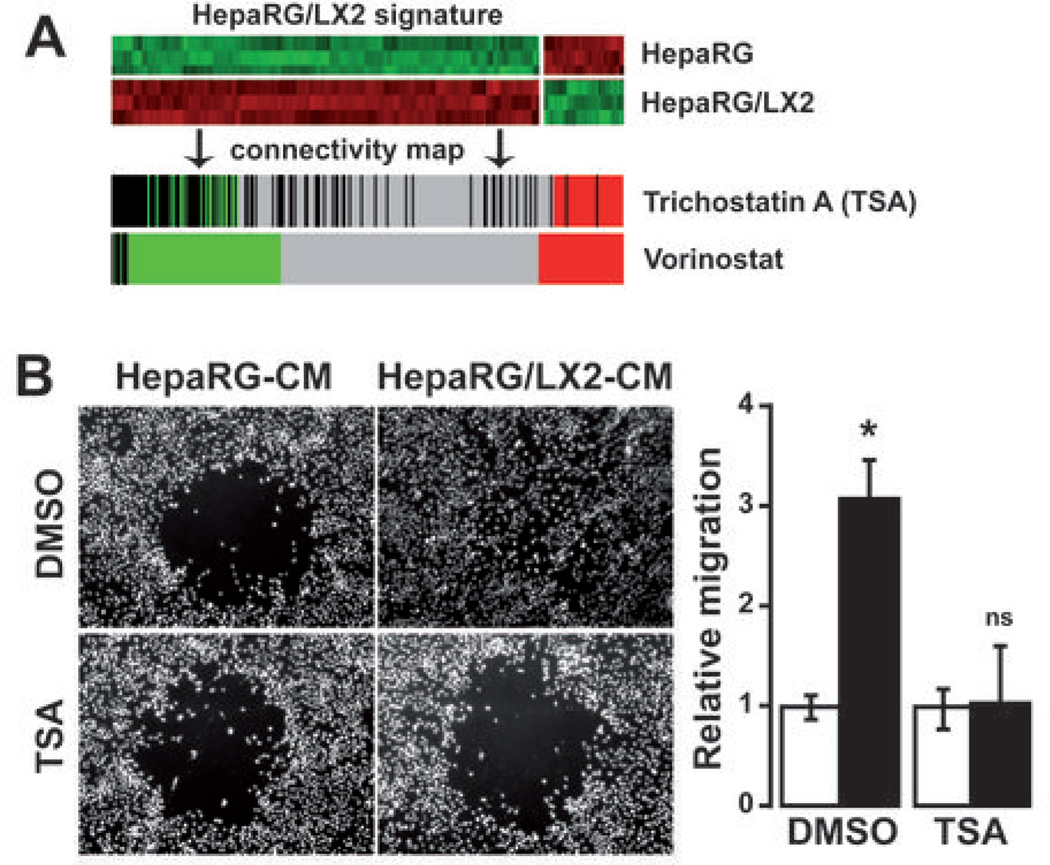
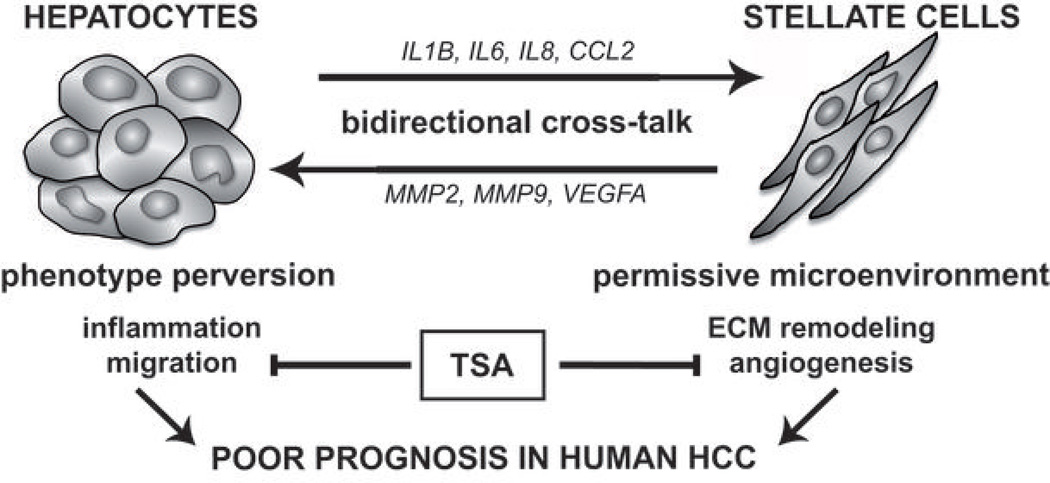
Many solid malignant tumors arise on a background of inflamed and/or fibrotic tissues, features that are found in more than 80% hepatocellular carcinomas (HCC). Activated hepatic stellate cells (HSC) play a critical role in fibrogenesis associated with HCC onset and progression, yet their functional impact on hepatocyte fate remains largely unexplored. Here, we used a coculture model to investigate the cross-talk between hepatocytes (human hepatoma cells) and activated human HSCs. Unsupervised genome-wide expression profiling showed that hepatocyte-HSC cross-talk is bidirectional and results in the deregulation of functionally relevant gene networks. Notably, coculturing increased the expression of proinflammatory cytokines and modified the phenotype of hepatocytes toward motile cells. Hepatocyte-HSC cross-talk also generated a permissive proangiogenic microenvironment, particularly by inducing VEGFA and matrix metalloproteinase (MMP)9 expression in HSCs. An integrative genomic analysis revealed that the expression of genes associated with hepatocyte-HSC cross-talk correlated with HCC progression in mice and was predictive of a poor prognosis and metastasis propensity in human HCCs. Interestingly, the effects of cross-talk on migration and angiogenesis were reversed by the histone deacetylase inhibitor trichostatin A. Our findings, therefore, indicate that the cross-talk between hepatoma cells and activated HSCs is an important feature of HCC progression, which may be targeted by epigenetic modulation.


Figures

Figure 1
Figure 1
Genome-wide expression profiles changes in cocultures of HepaRG and LX2. HepaRG and LX2 cell lines were cultured alone or side by side using transwell inserts (n=3 independent culture experiments). After 48hrs, total RNA was extracted from culture and coculture experiments and subjected to a microarray analysis. (A) Volcano plot (left) and clustering analysis (right) of 212 genes differentially expressed in three independent experiments using HepaRG cultured alone (HepaRG) or in presence of LX2 (HepaRG/LX2). (B) Volcano plot (left) and clustering analysis (right) of 123 genes differentially expressed in three independent experiments using LX2 cultured alone (LX2) or in presence of HepaRG (LX2/HepaRG). In (A) and (B), RNAs were selected based on the significance of the differential gene expression in coculture vs culture conditions (horizontal red line; P<0.01) and the level of induction or repression (vertical red lines; fold-change >1.5); examples of main changes in steady-state levels of mRNAs are indicated on the right.
Figure 2
Figure 2
The HepaRG/LX2 gene signature is related to inflammation. (A) Ingenuity analysis of up-regulated genes identified a gene network centered on IL1B, IL6, IL8 and CCL2. (B) Comparison of IL6, IL8, and CCL2/MCP1 mRNA levels detected by microarray and Q-RT-PCR in HepaRG using independent 48 hrs cultures (white bar, HepaRG cultured alone; black bar, HepaRG cocultured with LX2; n=3). Both microarray and Q-RT-PCR showed an up-regulation of these cytokines in cocultured HepaRG (* P<0.01). (C) GSEA analysis using the gene expression profiles of HepaRG cultured alone (HepaRG; right side) or in presence of LX2 (HepaRG/LX2; left side) and a proinflammatory gene signature established in Hep3B cell line (25). GSEA demonstrated a significant enrichment of the pro-inflammatory gene signature in HepaRG/LX2 gene expression profiles (P<0.01).
Figure 3
Figure 3
Conditioned medium from HepaRG/LX2 cocultures induces HepaRG migration. Cell migration was analyzed by a gap closure assay. After seeding (T0), HepaRG were cultured in presence of conditioned medium derived from HepaRG cultures (HepaRG-CM) or HepaRG/LX2 cocultures (HepaRG/LX2-CM). After 48 hrs, cells were fixed and nuclei were stained with a DAPI fluorescent dye (48h-DAPI). Image analysis demonstrated that HepaRG/LX2-CM induces a migration of HepaRG (white bar, HepaRG-CM; black bar, HepaRG/LX2-CM; n=3; * P<0.01).
Figure 4
Figure 4
HepaRG-LX2 crosstalk induces in vitro angiogenesis and MMP expression. (A) Ingenuity pathway analysis of genes up-regulated in LX2 cocultured with HepaRG identified a gene network connected to VEGFA and MMP9. (B) Both VEGFA and MMP9 mRNA levels were up-regulated in LX2 after 48 hrs coculture with HepaRG (black bar) as compared to culture alone (white bar); gene expression analysis was performed in genome-wide array and Q-RT-PCR using independent culture experiments (n=3). (C) In vitro angiogenesis assay using HUVEC grown on a Geltrex matrix in presence of conditioned medium (CM) derived from the culture of LX2 (LX2-CM) or the coculture of LX2 with HepaRG (LX2/HepaRG-CM). After 6hrs, tube formation by HUVEC was observed in wells corresponding to positive control and treatment with LX2/HepaRG-CM (n=3; representative images are shown). (D) Detection of MMPs by gelatin zymography in culture-CM and coculture-CM. Significant increased in MMP2 and MMP9 expression was measured in LX2/HepaRG-CM. B,D; n=3; * P<0.01.
Figure 5
Figure 5
Clinical relevance of HepaRG/LX2 signature in human HCC. (A) Dendrogram overview of HepaRG and HepaRG/LX2 experiments integrated with 139 cases of human HCC. Clustering analysis was based on the expression of 212 genes differentially expressed in HepaRG cocultured with LX2. Two major clusters (1 and 2) were identified. Distribution of human HCC samples between previously described subgroups with respect to survival (27) (good vs bad prognosis), cell origin (28) (hepatoblast vs hepatocytes), activation of MET/HGF (26) (− vs +) and TGFβ signaling pathway (20) (early vs late) is indicated on the left. (B) Statistical analysis of HCC distribution between clusters 1 and 2 based on previous gene signatures and clinical parameters. Cluster 1, which is defined by the HepaRG/LX2 coculture signature, shows a significant enrichment in HCC with the following features: bad survival, hepatoblast traits, activation of MET/HGF and late TGFβ pathways, higher differentiation grade and serum AFP level. Tumors size was significantly higher for HCC included in cluster 1. Kaplan-Meier plots and log-rank statistics analysis revealed a significant decreased in overall survival for patients included in cluster 1. (C) Integrative genomics using HepaRG/LX2 signature and gene expression profiles of peri-tumoral cirrhotic tissues from patient with (MIM) or without (MAM) metastasis (31). Clustering analysis (upper panel) and GSEA (lower panel) shows that the HepaRG/LX2 signature was significantly enriched in the gene expression profiles of cirrhotic tissues from patients with metastasis (MIM).
Figure 6
Figure 6
Inhibition of LX2-induced migration of HepaRG by trichostatin A. (A) Connectivity map identification of trichostatin A (TSA) and vorinostat as candidate molecules to target HepaRG/LX2 crosstalk. (B) Cell migration was analyzed by a gap closure assay. After seeding, HepaRG were cultured in presence of conditioned medium derived from the culture (HepaRG-CM) or the coculture (HepaRG/LX2-CM) of HepaRG and LX2 exposed to either 500 nM TSA or DMSO control. After 72 hrs, cells were fixed and nuclei were stained with a DAPI fluorescent dye. Image analysis confirmed that HepaRG/LX2-CM induced migration of HepaRG (upper 2 micrographs) and demonstrated that migration was abolished in presence of TSA (lower 2 micrographs). Histogram: quantification of HepaRG migration (white bar, HepaRG-CM; black bar, HepaRG/LX2-CM; n=3; * P<0.01).
Figure 7
Figure 7
Proposed model for molecular crosstalk between hepatocytes and activated HSC in hepatocellular carcinoma.

References

    1. Hanahan D, Weinberg RA. Hallmarks of cancer: the next generation. Cell. 2011;144:646–674. - PubMed
    1. Bhowmick NA, Chytil A, Plieth D, et al. TGF-beta signaling in fibroblasts modulates the oncogenic potential of adjacent epithelia. Science. 2004;303:848–851. - PubMed
    1. Trimboli AJ, Cantemir-Stone CZ, Li F, et al. Pten in stromal fibroblasts suppresses mammary epithelial tumours. Nature. 2009;461:1084–1091. - PMC - PubMed
    1. Nelson CM, Bissell MJ. Of extracellular matrix, scaffolds, and signaling: tissue architecture regulates development, homeostasis, and cancer. Annu Rev Cell Dev Biol. 2006;22:287–309. - PMC - PubMed
    1. Polyak K, Haviv I, Campbell IG. Co-evolution of tumor cells and their microenvironment. Trends Genet. 2009;25:30–38. - PubMed

Publication types