. 2011 Feb 6;1(1):36-47.
doi: 10.1098/rsfs.2010.0009. Epub 2010 Nov 24.

An automaton model for the cell cycle

Affiliations

An automaton model for the cell cycle

Atilla Altinok et al. Interface Focus. .

Abstract

WE CONSIDER AN AUTOMATON MODEL THAT PROGRESSES SPONTANEOUSLY THROUGH THE FOUR SUCCESSIVE PHASES OF THE CELL CYCLE: G1, S (DNA replication), G2 and M (mitosis). Each phase is characterized by a mean duration τ and a variability V. As soon as the prescribed duration of a given phase has passed, the transition to the next phase of the cell cycle occurs. The time at which the transition takes place varies in a random manner according to a distribution of durations of the cell cycle phases. Upon completion of the M phase, the cell divides into two cells, which immediately enter a new cycle in G1. The duration of each phase is reinitialized for the two newborn cells. At each time step in any phase of the cycle, the cell has a certain probability to be marked for exiting the cycle and dying at the nearest G1/S or G2/M transition. To allow for homeostasis, which corresponds to maintenance of the total cell number, we assume that cell death counterbalances cell replication at mitosis. In studying the dynamics of this automaton model, we examine the effect of factors such as the mean durations of the cell cycle phases and their variability, the type of distribution of the durations, the number of cells, the regulation of the cell population size and the independence of steady-state proportions of cells in each phase with respect to initial conditions. We apply the stochastic automaton model for the cell cycle to the progressive desynchronization of cell populations and to their entrainment by the circadian clock. A simple deterministic model leads to the same steady-state proportions of cells in the four phases of the cell cycle.

Keywords: cell cycle; cellular automaton; desynchronization; model; synchronization.


Figures

Figure 1.
Figure 1.
(a) Scheme of the automaton model for the cell cycle. Each cell switches sequentially between the phases G1, S, G2 and M, after which the cell divides and the two daughter cells enter a new G1 phase. The duration of each phase is determined stochastically (according to a uniform or lognormal distribution). When the time of the current phase is elapsed, the cell switches to the next phase. At any time, each cell can be marked for death with a given probability, but the cells marked for death exit the cell cycle only at the next G1/S or G2/M transitions. (b) Default mean duration of each phase of the cell cycle considered in numerical simulations of the automaton model.
Figure 2.
Figure 2.
Algorithm of the stochastic automaton model for the cell cycle shown in figure 1 (see also text for a detailed description). The corresponding computer code (in Matlab) is provided in the electronic supplementary material.
Figure 3.
Figure 3.
(a) Dynamics of a single automaton undergoing repetitive cell cycles. (b) Distribution of the total cell cycle duration over 10 000 cycles. The duration of each cell phase is taken from uniform distributions with the means τG1 = 9 h, τS = 11 h, τG2 = 1 h and τM = 1 h (the total duration of the cell cycle is equal to 22 h), and a variability V = 20%.
Figure 4.
Figure 4.
Homeostasis and the probability of cell death. (ac) The probability of death is not regulated by the size of the population and the number of cells either stabilizes at its (a) initial value, (b) decreases or (c) increases, depending on the relative value of P0 with respect to Ph (see appendix A.1). (df) The probability of cell death is modulated by the cell population size according to equation (3.11). In (a, d), P0 = 0.525 × 10−3 = Ph. In (b,e) P0 = 0.55 × 10⁻³ > Ph. In (c,f) P0 = 0.50 × 10⁻³ < Ph. In (df) ks = 0.001 min−1, NS = 104. At t = 0, the total number of cells is 104 and all cells start in the G1 phase. The total cell cycle duration is equal to 22 h (τG1 = 9 h, τS = 11 h, τG2 = 1 h and τM = 1 h), and the variability V = 20%.
Figure 5.
Figure 5.
Dynamics of the cell cycle automaton for increasing values of the initial number of cells in the population: (a) N0 = 10, (b) N0 = 100, (c) N0 = 1000 and (d) N0 = 10 000. In all cases, the total cell cycle duration is equal to 22 h and the mean durations of the phases are as in figure 4. Moreover, V = 10%, P0 = 0.525 × 10⁻³ (homeostasis is achieved without logistic regulation of the probability of cell death).
Figure 6.
Figure 6.
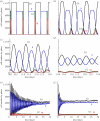
Effect of the variability of the durations of the cell cycle phases: (a) V = 0%, (b) V = 5%, (c) V = 10%, (d) V = 20%, (e) V = 20% (long time run) and (f) V = 50% (long time run). The mean durations of the cell cycle phases are as in figure 4; P0 = 0.525 × 10⁻³ (homeostasis is achieved without logistic regulation of the probability of cell death). The initial number of cells is N0 = 10 000 cells.
Figure 7.
Figure 7.
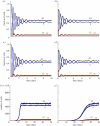
Effect of initial conditions: independence of the steady-state proportions of cells in the four phases of the cell cycle. Total cycle length and durations of the cell cycle phases are as in figure 4, with V = 50%, P0 = 0.525 × 10⁻³. In (a,b) homeostasis is achieved without logistic regulation of cell death probability: P0 = 0.525 × 10⁻³. In (cf) cell death probability is regulated according to the logistic equation (3.1), with P0 = 0.525 × 10⁻³, ks = 0.001 min−1 (ce) or 0.0002 min−1 (f), NS = 104. (a,c) All cells are initially in G1. (b,d) Initially, 25% of cells are in each phase. (e,f) Initially, there is a single cell in G1. In all cases the automaton evolves towards the same steady-state proportions of cells in each phase.
Figure 8.
Figure 8.
Effect of the mean cell cycle phase durations on the steady-state proportions of cells in each phase. The total cell cycle duration is equal to 22 h in (a), with τG1 = 9 h, τS = 11 h, τG2 = 1 h and τM = 1 h. In (b) the total cell cycle duration is still equal to 22 h, but τG1 = 14 h, τS = 6 h, τG2 = 1 h and τM = 1 h. Homeostasis is achieved without regulation of the probability of cell death (P0 = Ph = 0.525 × 10⁻³), N0 = 1000 and V = 20%. The steady-state proportions of cells in each phase are the same as those predicted by the deterministic model in §4. When setting dG1/dt = dS/dt = dG2/dt = dM/dt = 0 in equations (4.1), we obtain the following proportions at steady state: G1 = 0.49, S = 0.45, G2 = 0.029 and M = 0.028 for the mean phase durations of (a), and G1 = 0.74, S = 0.20, G2 = 0.028 and M = 0.027 for (b).
Figure 9.
Figure 9.
Scheme of the model showing the control of the cell cycle by the circadian clock via Wee1 and Cdk1, which, respectively, inhibits and induces the G2/M transition.
Figure 10.
Figure 10.
Entrainment of the cell cycle automaton by the circadian clock via the circadian variation of Wee1 and Cdk1, which varies in a semi-sinusoidal manner. Wee1 varies in a semi-sinusoidal manner with a peak at 22.00 h so as to increase between 14.00 and 22.00 h and decrease from 22.00 to 4.00 h; it remains equal to zero from 4.00 to 14.00 h. Cdk1 varies in a similar manner, with a lag of 6 h, so as to increase between 22.00 and 4.00 h and decrease from 4.00 h to 22.00 h; it remains equal to zero from 10.00 to 22.00 h. The duration of the cell cycle prior to entrainment is equal to 22 h (τG1 = 9 h, τS = 11 h, τG2 = 1 h and τM = 1h) in (a), and 26 h (τG1 = 10 h, τS = 12 h, τG2 = 2 h and τM = 2 h) in (b). For both cases, V = 20% and homeostasis is achieved by logistic regulation of the probability of cell death, with P0= Ph = 0.000525, Ns = 10 000 and ks = 0.001.

References

    1. Morgan D. O. 2006. The cell cycle: principles of control. Oxford, UK: Oxford University Press
    1. Goldbeter A. 1991. A minimal cascade model for the mitotic oscillator involving cyclin and cdc2 kinase. Proc. Natl Acad. Sci. USA 88, 9107–911110.1073/pnas.88.20.9107 (doi:10.1073/pnas.88.20.9107) - DOI - DOI - PMC - PubMed
    1. Novak B., Tyson J. J. 1993. Numerical analysis of a comprehensive model of M-phase control in Xenopus oocyte extracts and intact embryos. J. Cell Sci. 106, 1153–1168 - PubMed
    1. Tyson J. J. 1991. Modeling the cell division cycle: cdc2 and cyclin interactions. Proc. Natl Acad. Sci. USA 88, 7328–733210.1073/pnas.88.16.7328 (doi:10.1073/pnas.88.16.7328) - DOI - DOI - PMC - PubMed
    1. Chen K. C., Calzone L., Csikasz-Nagy A., Cross F. R., Novak B., Tyson J. J. 2004. Integrative analysis of cell cycle control in budding yeast. Mol. Biol. Cell 15, 3841–386210.1091/mbc.E03-11-0794 (doi:10.1091/mbc.E03-11-0794) - DOI - DOI - PMC - PubMed