. 2011 Feb 6;1(1):101-16.
doi: 10.1098/rsfs.2010.0005. Epub 2010 Dec 3.

Construction and validation of anisotropic and orthotropic ventricular geometries for quantitative predictive cardiac electrophysiology

Affiliations

Construction and validation of anisotropic and orthotropic ventricular geometries for quantitative predictive cardiac electrophysiology

Alan P Benson et al. Interface Focus. .

Abstract

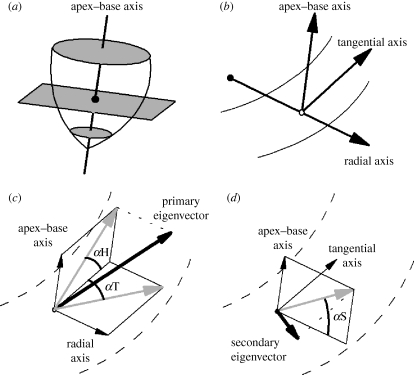
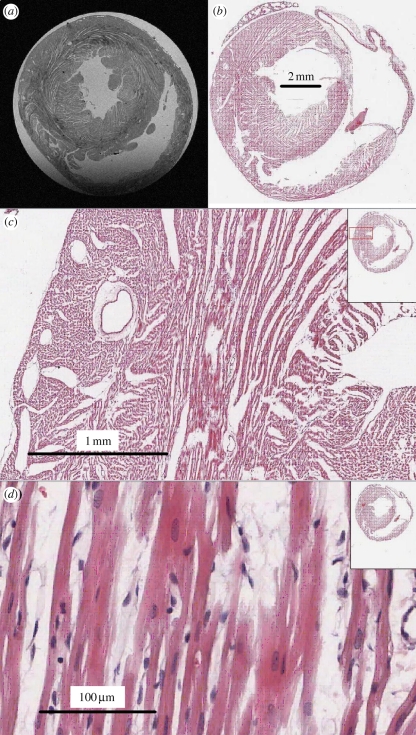
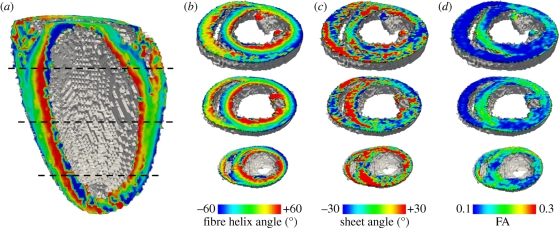
Reaction-diffusion computational models of cardiac electrophysiology require both dynamic excitation models that reconstruct the action potentials of myocytes as well as datasets of cardiac geometry and architecture that provide the electrical diffusion tensor D, which determines how excitation spreads through the tissue. We illustrate an experimental pipeline we have developed in our laboratories for constructing and validating such datasets. The tensor D changes with location in the myocardium, and is determined by tissue architecture. Diffusion tensor magnetic resonance imaging (DT-MRI) provides three eigenvectors e(i) and eigenvalues λ(i) at each voxel throughout the tissue that can be used to reconstruct this architecture. The primary eigenvector e(1) is a histologically validated measure of myocyte orientation (responsible for anisotropic propagation). The secondary and tertiary eigenvectors (e(2) and e(3)) specify the directions of any orthotropic structure if λ(2) is significantly greater than λ(3)-this orthotropy has been identified with sheets or cleavage planes. For simulations, the components of D are scaled in the fibre and cross-fibre directions for anisotropic simulations (or fibre, sheet and sheet normal directions for orthotropic tissues) so that simulated conduction velocities match values from optical imaging or plunge electrode experiments. The simulated pattern of propagation of action potentials in the models is partially validated by optical recordings of spatio-temporal activity on the surfaces of hearts. We also describe several techniques that enhance components of the pipeline, or that allow the pipeline to be applied to different areas of research: Q ball imaging provides evidence for multi-modal orientation distributions within a fraction of voxels, infarcts can be identified by changes in the anisotropic structure-irregularity in myocyte orientation and a decrease in fractional anisotropy, clinical imaging provides human ventricular geometry and can identify ischaemic and infarcted regions, and simulations in human geometries examine the roles of anisotropic and orthotropic architecture in the initiation of arrhythmias.

Keywords: cardiac arrhythmia; computational modelling; diffusion tensor magnetic resonance imaging; myocardium; optical imaging.


Figures

Figure 1.
Figure 1.
Coordinate and angle system used to describe fibre and sheet orientations in the heart. (a) A base–apex axis is fitted to the centre of the left ventricle. This axis is normal to the transverse plane, shown in grey. The centroid for each slice is the location where the apex–base axis intersects the transverse plane, and is shown as a filled circle. (b) For each voxel (shown here as an open circle), three orthogonal reference axes are defined. The base–apex axis is parallel to that defined previously, the radial axis passes through the centroid and the voxel, and the tangential axis lies in the transverse plane perpendicular to the other two axes. (c) The fibre helix (inclination) angle αH and the fibre transverse angle αT. (d) The sheet angle αS. In (c,d), the DT-MRI eigenvector is shown in bold; projections of this eigenvector are in grey.
Figure 2.
Figure 2.
Magnetic resonance image and histology of a short-axis section of rat ventricular myocardium illustrating cleavage planes. (a) Magnetic resonance image, obtained using a 9.4 T Bruker (Ettlingen, Germany) spectrometer with a 12.6 mm square field of view and 30 × 30 µm square pixels in the short-axis plane, with 0.25 µm in the z-direction. (bd) Histological sections through the short axis of a rat heart, illustrating cleavage planes. Images courtesy of A. Radjenovic, E. White, D. Benoist, J. Ainscough and S. Tanner, University of Leeds.
Figure 3.
Figure 3.
Architecture of rat heart visualized from DT-MRI with 0.2 mm isotropic voxels. (a,b) Transmural rotational anisotropy, visualized by a local average cell angle of inclination, or helix angle, estimated from the primary eigenvector. (c) ‘Sheet’ angle estimated from the secondary and tertiary eigenvectors. (d) Fractional anisotropy, computed from eigenvalues at each voxel by equation (2.1).
Figure 4.
Figure 4.
Optical mapping of surface spatio-temporal activity. (a) Epi-fluorescence optical mapping of Langendorff perfused heart. (b) Simulation of the subsurface tissue contribution to the surface optical signal for Di-4-ANEPPS, from a rotationally anisotropic transmural slab of depth 5 mm and radius 10 mm. Scale bar indicates the percentage contribution of each pixel to the total signal recorded from the top left pixel on the epicardial surface.
Figure 5.
Figure 5.
Surface maps imaged using Di-4-ANEPPS following epicardial point excitation in an isolated perfused rat heart. (a) Activation time. (b) Corresponding APD map. (c) formula image 
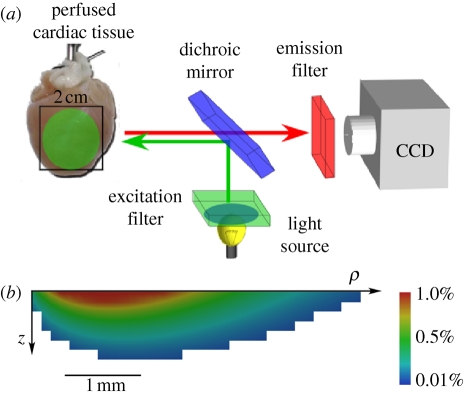
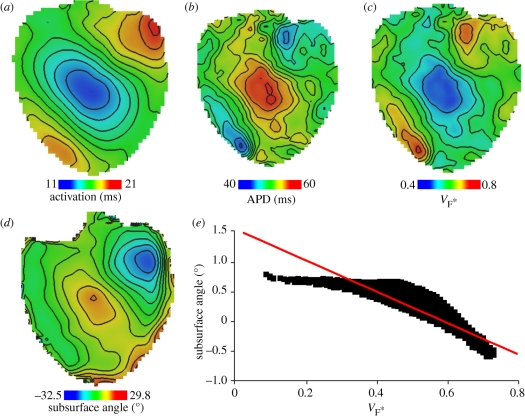
estimated from optical action potentials at each pixel. (d) Subsurface angle, computed assuming transmural rotational anisotropy in the visualized geometry. (e) Relationship between subsurface angle and formula image used for panel (d) and obtained using detailed photon migration models. Red line is the linear regression for steady-state wavefronts obtained using line excitation.
Figure 6.
Figure 6.
Simulation of homogeneous, anisotropic electrical activity (i.e. assuming a single cell type and fibre structure only, no sheets) in a rat geometry obtained using DT-MRI, with (0.2 mm3) voxels. (a) Fibre helix angle. (b) Computed activation times for an epicardial stimulation analogous to that in figure 5. (c) Corresponding APDs. (d) Action potentials recorded from voxels with early (top) and late (bottom) activation times. Note the modulation of the action potential morphology by the activation sequence in the electrically homogeneous domain—later activation times result in decreased APDs.
Figure 7.
Figure 7.
Q ball imaging (QBI) of ventricular myofibre architecture. (a) The reconstructed intravoxel fibre distributions (ODFs) for two voxels with one or multiple fibre orientation. (b) Fractional anisotropy in the posterior fusion site of a canine heart. (c) Goodness-of-fit (R2-coefficient) for the tensor approximation in the same region. (d) Reconstructed intravoxel ODFs from QBI (using Laplace–Beltrami sharpening) showing complex fibre arrangement in the central region of the fusion site. Imaged with a spin-echo protocol using TR/TE = 1800/15 ms, Δ = 7 ms, δ = 2 ms, b = 3000 s mm−2; spatial resolution 0.4 × 0.4 × 1.0 mm. The region of interest shown in panels (b,c) is 4.4 × 4.4 mm.
Figure 8.
Figure 8.
(a,b) Fractional anisotropy and (c,d) helix fibre angle in normal and infarcted rabbit hearts, eight weeks after coronary artery ligation. (e) Helix angle from the infarct zone and the corresponding basal interpapillary muscle region of a normal rabbit heart. Transmural distance is normalized to the ventricular wall thickness, and is from endocardium (0) to epicardium (1). Black circles, normal; red squares, infarct.
Figure 9.
Figure 9.
(a) Visualization of the human DT-MRI dataset geometry (see acknowledgements). The shaded area indicates the spatial extent of the wedge extracted from the left ventricular free wall. (b) View of the wedge geometry and fibre helix angle from an endocardial aspect. (c) Wavefront isosurface at 60 ms following epicardial excitation of human left ventricular free wall. The spatial extent of the wedge geometry is indicated in light blue; excited tissue is in red.
Figure 10.
Figure 10.
Snapshots of membrane potential and re-entrant scroll wave filament locations after 2 s of simulation in isotropic (no fibre or sheet structure), anisotropic (with fibre structure but without sheet structure) and orthotropic (with both fibre and sheet structure) cuboid and wedge models. Membrane potential is colour-coded using the standard rainbow palette, from blue (−70 mV) to red (30 mV). For both models, the snapshots are from an epicardial aspect, with the scroll wave rotating clockwise. The wedge dimensions are similar to those of the 60 × 60 × 20 mm cuboid.
Figure 11.
Figure 11.
Identification of ischaemic tissue in human ventricles by clinical cardiac magnetic resonance imaging. (a) First-pass stress perfusion images showing ischaemia (dark areas) in a patient with ischaemic heart disease. (b) The ischaemic area of panel (a) segmented by a simple threshold. (c) Visualization of ventricular myocardial perfusion in successive short-axis slices.

References

    1. Jalife J. 2000. Ventricular fibrillation: mechanisms of initiation and maintenance. Annu. Rev. Physiol. 62, 25–5010.1146/annurev.physiol.62.1.25 (doi:10.1146/annurev.physiol.62.1.25) - DOI - DOI - PubMed
    1. Vaquero M., Calvo D., Jalife J. 2008. Cardiac fibrillation: from ion channels to rotors in the human heart. Heart Rhythm 5, 872–87910.1016/j.hrthm.2008.02.034 (doi:10.1016/j.hrthm.2008.02.034) - DOI - DOI - PMC - PubMed
    1. Fenton F., Karma A. 1998. Vortex dynamics in three-dimensional continuous myocardium with fiber rotation: filament instability and fibrillation. Chaos 8, 20–4710.1063/1.166311 (doi:10.1063/1.166311) - DOI - DOI - PubMed
    1. Gray R. A., Pertsov A. M., Jalife J. 1998. Spatial and temporal organization during cardiac fibrillation. Nature 392, 75–7810.1038/32164 (doi:10.1038/32164) - DOI - DOI - PubMed
    1. Codreanu A., et al. 2008. Electroanatomic characterization of post-infarct scars: comparison with 3-dimensional myocardial scar reconstruction based on magnetic resonance imaging. J. Am. Coll. Cardiol. 52, 839–84210.1016/j.jacc.2008.05.038 (doi:10.1016/j.jacc.2008.05.038) - DOI - DOI - PubMed

LinkOut - more resources