. 2012 Mar 27;109(13):4774-9.
doi: 10.1073/pnas.1118959109. Epub 2012 Mar 14.

Magnetically sensitive light-induced reactions in cryptochrome are consistent with its proposed role as a magnetoreceptor

Affiliations

Magnetically sensitive light-induced reactions in cryptochrome are consistent with its proposed role as a magnetoreceptor

Kiminori Maeda et al. Proc Natl Acad Sci U S A. .

Abstract

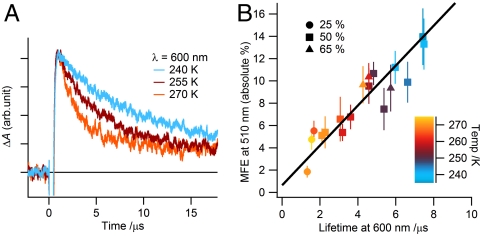
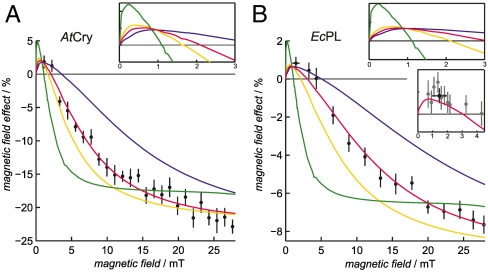
Among the biological phenomena that fall within the emerging field of "quantum biology" is the suggestion that magnetically sensitive chemical reactions are responsible for the magnetic compass of migratory birds. It has been proposed that transient radical pairs are formed by photo-induced electron transfer reactions in cryptochrome proteins and that their coherent spin dynamics are influenced by the geomagnetic field leading to changes in the quantum yield of the signaling state of the protein. Despite a variety of supporting evidence, it is still not clear whether cryptochromes have the properties required to respond to magnetic interactions orders of magnitude weaker than the thermal energy, k(B)T. Here we demonstrate that the kinetics and quantum yields of photo-induced flavin-tryptophan radical pairs in cryptochrome are indeed magnetically sensitive. The mechanistic origin of the magnetic field effect is clarified, its dependence on the strength of the magnetic field measured, and the rates of relevant spin-dependent, spin-independent, and spin-decoherence processes determined. We argue that cryptochrome is fit for purpose as a chemical magnetoreceptor.


Conflict of interest statement

The authors declare no conflict of interest.

Figures

Fig. 1.
Fig. 1.
The electron transfer pathway leading from the protein surface to the FAD cofactor buried within the protein. Shown are the relative positions of the FAD cofactor and the Trp-triad (WA, WB, WC) in AtCry [blue, PDB entry 1U3D (37)] and EcPL [red, PDB entry 1DNP (48)]. The proposed magnetically sensitive species comprises a radical derived from the FAD and one from the terminal tryptophan residue, WC (Trp-324 in AtCry; Trp306 in EcPL). The center-to-center distance between the tricyclic isoalloxazine ring system of FAD and the indole group of WC is 1.90 nm in AtCry (37).
Fig. 2.
Fig. 2.
Transient absorption spectra and magnetic-field action spectra of AtCry and EcPL. Transient absorption spectra, ΔA(0), of (A) AtCry and (C) EcPL. ΔA(0) is the difference between signals recorded with and without a 460 nm, 5 ns pump light pulse in the absence of an applied magnetic field. The spectra were integrated over 1 μs periods centered at the indicated times after the pump pulse. Each spectrum is the average of two transients. The laser repetition rate was kept low (0.05 Hz) to minimize protein photodegradation. The 1.5 μs signal in (C) at 460 nm is distorted by a transient effect of the laser pulse on the photomultiplier detector. Experimental conditions: AtCry, 250 K, 60% (v/v) glycerol solution; EcPL, 250 K, 50% (v/v) glycerol solution. (B) and (D) Magnetic-field action spectra of AtCry and EcPL, respectively, recorded under the same conditions as (A) and (C), presented as ΔΔA = ΔA(28 mT) - ΔA(0). Two transients were recorded with the magnetic field and two without. At each wavelength the double-difference kinetic time profiles were smoothed with a 2 μs boxcar function and the mean and standard deviation calculated over the indicated time intervals. At each wavelength the mean ± standard deviation is plotted. The minor differences between the data shown in (C) and (D) and the data reported by Henbest et al. (23) are attributed to the different experimental conditions of the latter: 278 K, 20% (v/v) glycerol, 5 mM potassium ferricyanide.
Fig. 3.
Fig. 3.
Magnetic-field effects on the photochemical kinetics of AtCry and EcPL. Transient absorption kinetic time profiles of (A) AtCry and (C) EcPL both recorded at 510 nm with and without a 28 mT applied magnetic field. (B) and (D) Differences between the two signals shown in (A) and in (C), respectively: ΔΔA = ΔA(28 mT) - ΔA(0). 200 ns boxcar smoothing was used to produce (B) and (D); no smoothing was used for (A) and (C). Experimental conditions: AtCry, 270 K in 60% (v/v) glycerol solution; EcPL, 250 K in 50% (v/v) glycerol solution. Similar traces for both proteins were observed at temperatures between 240 K and 275 K and glycerol contents between 25% and 65% (SI Appendix).
Fig. 4.
Fig. 4.
Proposed photochemical reaction schemes for AtCry and EcPL. The black arrows and species are common to both proteins; the blue and red features refer to AtCry and EcPL, respectively. kb and kf are first-order rate constants for electron–hole recombination of RP1 and formation of RP2 from RP1, respectively. Although RP2 in AtCry is here drawn as [FADHTrp], the protonation state of the Trp radical is not certain. The curved green arrows indicate the coherent, magnetic field-dependent interconversion of the singlet and triplet states of RP1.
Fig. 5.
Fig. 5.
Correlation between the magnetic-field effect on the yield of RP2 and the lifetime of RP1 in EcPL. (A) Transient absorption kinetic time profiles of EcPL in 50% (v/v) glycerol solution in the absence of an applied magnetic field at the temperatures indicated. Recorded at 600 nm, these signals reflect the kinetics of the reactions: TrpH+ → Trp + H+ and 1[FAD•-TrpH•+] → FAD + TrpH (Fig. 4). Lifetimes were extracted from such data by fitting to a monoexponential decay with a constant offset. (B) Effect of a 28 mT magnetic field on the yield of RP2 (recorded at 510 nm) plotted against the lifetime of RP1 (measured at 600 nm) over a range of temperatures and glycerol concentrations, as indicated. The vertical axis is the absolute value of the fractional magnetic-field effect (MFE): |ΔA(28 mT) - ΔA(0)|/ΔA(0). The data plotted here are given in the SI Appendix.
Fig. 6.
Fig. 6.
Magnetic field-dependence of the yield of RP2 in AtCry and EcPL. The percentage change in the yield of RP2 (measured at 510 nm) as a function of the strength of the applied magnetic field for (A) AtCry and (B) EcPL. Experimental conditions: (A) AtCry, 60% glycerol, 270 K; (B) EcPL, 50% glycerol, 260 K. The red lines are the best-fit simulations obtained using the singlet-triplet dephasing model described in the text, with kf = 2.5 × 105 s-1 and (A) kb = 4.9 × 105 s-1,kSTD = 1.1 × 107 s-1; (B) kb = 1.2 × 105 s-1,kSTD = 2.7 × 107 s-1. The other lines are simulations with the same values of kf and kb but (A) kSTD/s-1 = 0 (green), 5 × 106 (yellow), 5 × 107 (blue); (B) kSTD/s-1 = 0 (green), 1 × 107 (yellow), 1 × 108 (blue). The two larger insets show expanded views of the simulations in the low field region. The irregularities visible in some of these curves arise from energy-level anticrossings. The smaller inset in (B) shows, on an expanded scale, the best-fit simulation together with 8 measurements in the range 0.7–2.2 mT that were averaged to obtain the (black) point plotted at B = 1.5 mT in this inset and in the main panel. The error bars associated with this data point represent ± one standard deviation of the eight measurements. Each data point in the main panels is the average of (A) 10 and (B) 40 (> 3 mT) or 80 (< 3 mT) transients. At each applied magnetic-field strength B, the double-difference kinetic time profiles ΔA(B) - ΔA(0) were smoothed with (A) 5 μs and (B) 0.5 μs boxcar functions. The mean ± standard deviation (calculated over the time intervals: (A) 2–170 μs and (B) 7–15 μs is plotted for each datum.

References

    1. Ahmad M, Cashmore AR. HY4 gene of A. thaliana encodes a protein with characteristics of a blue-light photoreceptor. Nature. 1993;366:162–166. - PubMed
    1. Chaves I, et al. The cryptochromes: Blue light photoreceptors in plants and animals. Annu Rev Plant Biol. 2011;62:335–364. - PubMed
    1. Weber S. Light-driven enzymatic catalysis of DNA repair: A review of recent biophysical studies on photolyase. Biochim Biophys Acta. 2005;1707:1–23. - PubMed
    1. Sancar A. Structure and function of photolyase and in vivo enzymology: 50th anniversary. J Biol Chem. 2008;283:32153–32157. - PMC - PubMed
    1. Ritz T, Adem S, Schulten K. A model for photoreceptor-based magnetoreception in birds. Biophys J. 2000;78:707–718. - PMC - PubMed

Publication types

LinkOut - more resources