. 2012 Jun;22(6):1069-80.
doi: 10.1101/gr.129817.111. Epub 2012 Mar 15.

Chromatin state signatures associated with tissue-specific gene expression and enhancer activity in the embryonic limb

Affiliations

Chromatin state signatures associated with tissue-specific gene expression and enhancer activity in the embryonic limb

Justin Cotney et al. Genome Res. 2012 Jun.

Abstract

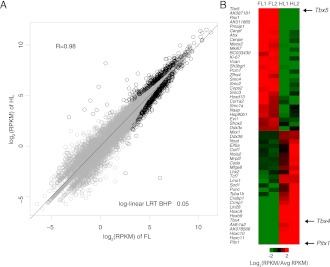
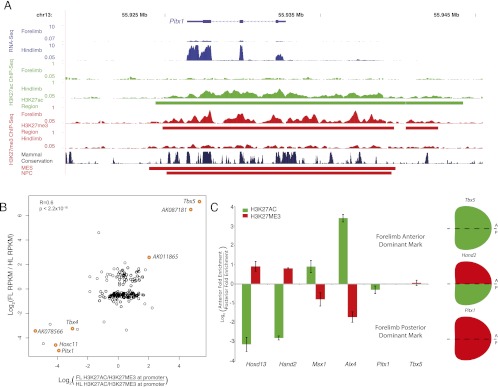
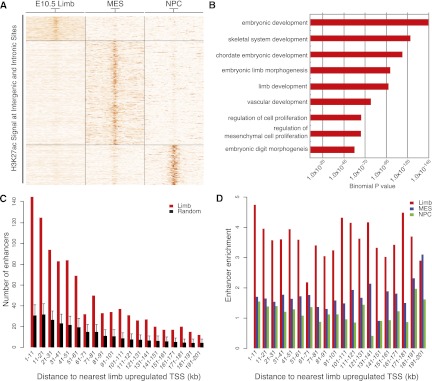
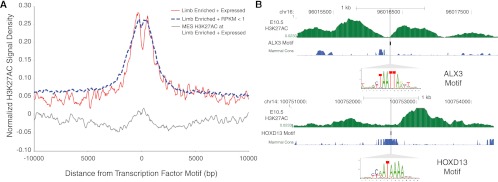
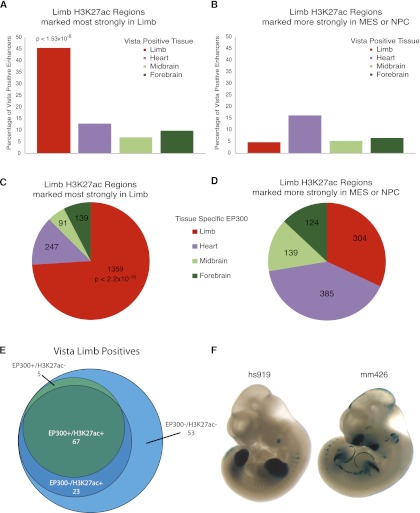
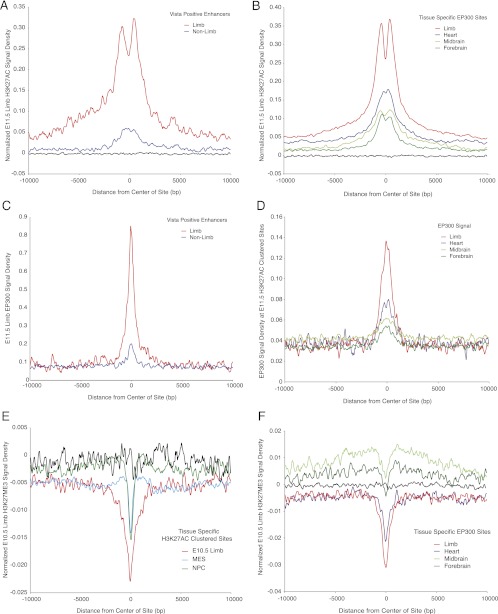
The regulatory elements that direct tissue-specific gene expression in the developing mammalian embryo remain largely unknown. Although chromatin profiling has proven to be a powerful method for mapping regulatory sequences in cultured cells, chromatin states characteristic of active developmental enhancers have not been directly identified in embryonic tissues. Here we use whole-transcriptome analysis coupled with genome-wide profiling of H3K27ac and H3K27me3 to map chromatin states and enhancers in mouse embryonic forelimb and hindlimb. We show that gene-expression differences between forelimb and hindlimb, and between limb and other embryonic cell types, are correlated with tissue-specific H3K27ac signatures at promoters and distal sites. Using H3K27ac profiles, we identified 28,377 putative enhancers, many of which are likely to be limb specific based on strong enrichment near genes highly expressed in the limb and comparisons with tissue-specific EP300 sites and known enhancers. We describe a chromatin state signature associated with active developmental enhancers, defined by high levels of H3K27ac marking, nucleosome displacement, hypersensitivity to sonication, and strong depletion of H3K27me3. We also find that some developmental enhancers exhibit components of this signature, including hypersensitivity, H3K27ac enrichment, and H3K27me3 depletion, at lower levels in tissues in which they are not active. Our results establish histone modification profiling as a tool for developmental enhancer discovery, and suggest that enhancers maintain an open chromatin state in multiple embryonic tissues independent of their activity level.


Figures

Figure 1.
Figure 1.
Whole-transcriptome analysis of mouse E10.5 limb. (A) Log2 (RPKM) values for 27,189 genes compared between a single biological replicate of forelimb and hindlimb. Genes identified as differentially expressed by log-linear LRT (BHP <0.05) are shown as black circles. (B) Heatmap of selected genes significantly differentially expressed between forelimb and hindlimb. For each gene listed, RPKMs were averaged across all replicates and values for individual replicates are plotted as a log2 fold change relative to this average value.
Figure 2.
Figure 2.
Relative H3K27ac and H3K27me3 enrichments at promoters correlate with gene expression in E10.5 limb buds. (A) Gene expression (blue), H3K27ac signal (green), and H3K27me3 signal (red) at the hindlimb-specific gene Pitx1. All signal plots represent reads per million mapped total reads. Green and red bars below signal plots, respectively, illustrate H3K27ac or H3K27me3-enriched regions in limb. H3K27me3-enriched regions in MES and NPC cell lines are shown at bottom. The figure was generated using the UCSC Genome Browser. (B) Scatterplot of the ratio of log2(RPKM) values for genes differentially expressed between forelimb and hindlimb versus the log2(ratio of H3K27ac vs. H3K27me3 signals at their promoters). Selected known and novel limb genes that show strong correlations between these values are indicated in orange. The P-value shown was calculated using a linear regression t-test. (C) Bar chart depicting relative levels of H3K27ac and H3K27me3 enrichment at indicated gene promoters in the anterior and posterior halves of E10.5 forelimb buds. (Right) The dominant mark present for representative genes that are ubiquitously expressed (Tbx5), completely repressed (Pitx1), or regionally restricted (Hand2).
Figure 3.
Figure 3.
Tissue-specific H3K27ac intergenic and intronic regions are associated with genes up-regulated in E10.5 limb. Intergenic and intronic H3K27ac regions in limb, MES, and NPC were identified and merged as described in the main text. (A) K-means clustering of H3K27ac signals (in RPKM) across 39,750 merged regions, using an 8-kb window centered on the midpoint of each region, revealed three tissue-specific classes of H3K27ac-enriched regions. (B) Selected GO Biological Process category enrichments identified by GREAT analysis of “limb-specific” H3K27ac regions. (C) Counts of limb-specific H3K27ac regions (red) relative to random sites (black) near genes up-regulated in limb. Each region was assigned to the nearest transcription start site up to 200 kb away, and enrichment of limb-specific regions near limb up-regulated genes was calculated in 10-kb bins. Error bars represent the 95% quartile of values from 1000 randomized sets of intergenic and intronic sequences. (D) Enrichment of assigning a limb (red), MES (blue), or NPC-specific region (green) to a limb up-regulated gene versus random regions used in C up to 200 kb away.
Figure 4.
Figure 4.
Strongly marked limb H3K27ac regions are enriched for limb transcription-factor binding sites. (A) E10.5 limb H3K27ac signal density plots normalized for input in a 20-kb window centered on limb-enriched transcription-factor (TF) motifs (Methods) for factors expressed highly in limb versus those that are expressed at low levels (RPKM <1). Those TF motifs that are enriched in limb and whose corresponding factors are highly expressed show signatures of H3K27ac modified nucleosome displacement (red). Motifs enriched in limb, but whose factors are expressed at low levels do not exhibit nucleosome displacement (blue). MES H3K27ac signal at limb-enriched motifs for TFs highly expressed in limb shows low signal and no nucleosome displacement (gray). (B) Displacement of H3K27ac signal in H3K27ac-enriched regions relative to the presence of predicted binding sites for Alx3 (top) and Hoxd13 (bottom).
Figure 5.
Figure 5.
H3K27ac identifies tissue specific enhancers. (A) Percentage of known enhancers from the Vista Enhancer Browser that overlap E11.5 H3K27ac regions strongly marked in limb compared with MES or NPC (from Supplemental Fig. S8). (Bars) Percentage of total positive enhancers active in the indicated tissue that are marked by H3K27ac in limb. Limb enhancers are significantly enriched versus enhancers active in other tissues (Fisher exact test). (B) Overlap of H3K27ac regions in limb that are more strongly marked in either MES or NPC and Vista enhancers. (C) Overlap of E11.5 H3K27ac regions strongly marked in limb compared with MES and NPC with tissue-specific EP300 sites. Limb EP300 sites are significantly over-represented (Fisher exact test). (D) Overlap of H3K27ac regions that are more strongly marked in either MES or NPC and tissue-specific EP300 sites. (E) Venn diagram of Vista limb enhancers marked by limb EP300, limb H3K27ac, both, or neither. (F) Representative Vista limb enhancers identified by E11.5 H3K27ac alone.
Figure 6.
Figure 6.
Active and inactive enhancers are marked by both EP300 and H3K27ac. (A) E11.5 limb H3K27ac signal density normalized for input was determined in a 20-kb window surrounding the center of Vista limb enhancers or positive enhancers with no limb annotation. The strongest signal and nucleosome displacement are observed at known limb positive enhancers. Active enhancers with no observed limb activity are marked with low levels of H3K27ac. Black lines represent signal at random intergenic and intronic regions. (B) E11.5 limb H3K27ac signal density normalized for input at tissue-specific intergenic and intronic EP300 sites. Signal is strongest at limb-specific EP300 sites and shows a strong signal of H3K27ac modified nucleosome displacement. Other tissue-specific EP300 sites are enriched for H3K27ac compared with random regions (black), but at lower levels. (C) Limb EP300 signal density at Vista limb enhancers or positive enhancers with no limb annotation. Signal was normalized versus random regions since no input was performed for these experiments. Limb EP300 signal is strongest at known limb enhancers, but is also present at low levels at enhancers with no limb activity. (D) EP300 signal density from four mouse tissues at E11.5 H3K27ac clustered sites. Signal was normalized versus random regions as in C. EP300 signal from limb is strongest at limb-specific H3K27ac regions, but EP300 signal from other tissues is also present at limb-specific H3K27ac regions. (E) E10.5 limb H3K27me3 signal density normalized for input at tissue-specific H3K27ac intronic and intergenic regions identified in this study. All classes show depletion of H3K27me3 versus random genomic regions (black), but limb-specific regions are most depleted. (F) E10.5 limb H3K27me3 signal density normalized for input at tissue-specific intergenic and intronic EP300 sites. All classes show depletion of H3K27me3 relative to their surrounding genomic locations. Limb and heart-specific sites exhibit depletion versus random genomic regions (black).

References

    1. Auerbach RK, Euskirchen G, Rozowsky J, Lamarre-Vincent N, Moqtaderi Z, Lefrançois P, Struhl K, Gerstein M, Snyder M 2009. Mapping accessible chromatin regions using Sono-Seq. Proc Natl Acad Sci 106: 14926–14931 - PMC - PubMed
    1. Blow MJ, McCulley DJ, Li Z, Zhang T, Akiyama JA, Holt A, Plajzer-Frick I, Shoukry M, Wright C, Chen F, et al. 2010. ChIP-seq identification of weakly conserved heart enhancers. Nat Genet 42: 806–810 - PMC - PubMed
    1. Bonn S, Zinzen RP, Girardot C, Gustafson EH, Perez-Gonzalez A, Delhomme N, Ghavi-Helm Y, Wilczyński B, Riddell A, Furlong EEM 2012. Tissue-specific analysis of chromatin state identifies temporal signatures of enhancer activity during embryonic development. Nat Genet 48: 148–156 - PubMed
    1. Boyer LA, Plath K, Zeitlinger J, Brambrink T, Medeiros LA, Lee TI, Levine SS, Wernig M, Tajonar A, Ray MK, et al. 2006. Polycomb complexes repress developmental regulators in murine embryonic stem cells. Nature 441: 349–353 - PubMed
    1. Bullard JH, Purdom E, Hansen KD, Dudoit S 2010. Evaluation of statistical methods for normalization and differential expression in mRNA-seq experiments. BMC Bioinformatics 11: 94 doi: 10.1186/1471-2105-11-94 - PMC - PubMed

Publication types

Associated data