. 2012 Apr 13;336(6078):233-7.
doi: 10.1126/science.1215704. Epub 2012 Mar 15.

Ribosome profiling shows that miR-430 reduces translation before causing mRNA decay in zebrafish

Affiliations

Ribosome profiling shows that miR-430 reduces translation before causing mRNA decay in zebrafish

Ariel A Bazzini et al. Science. .

Abstract

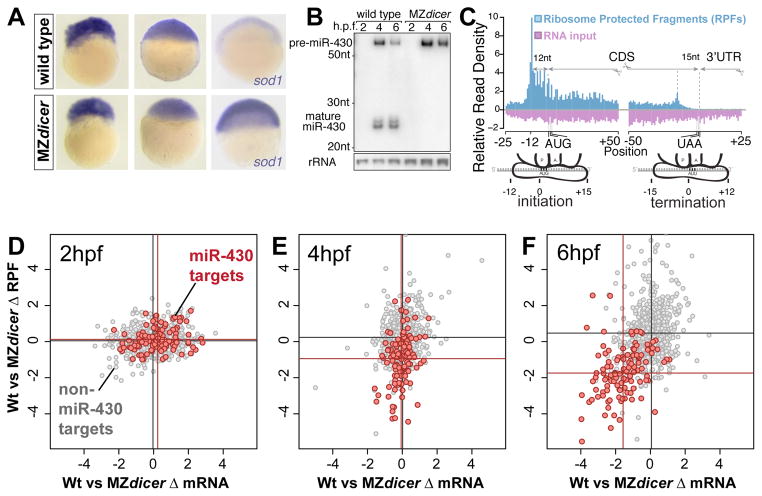
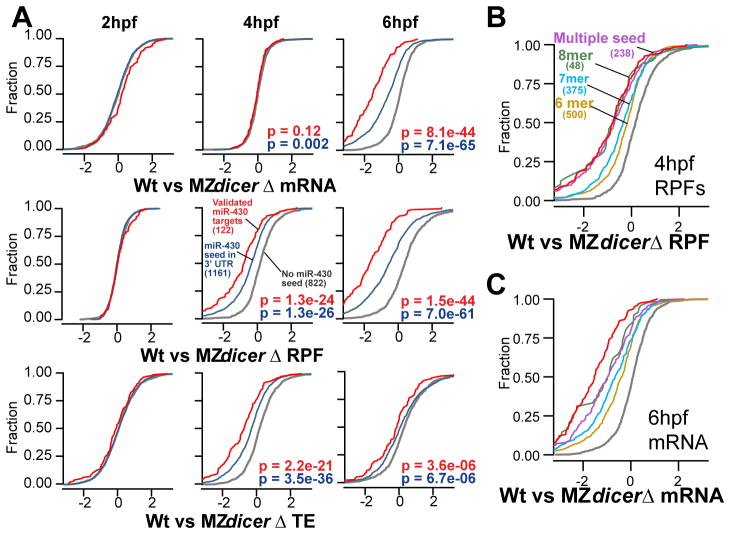
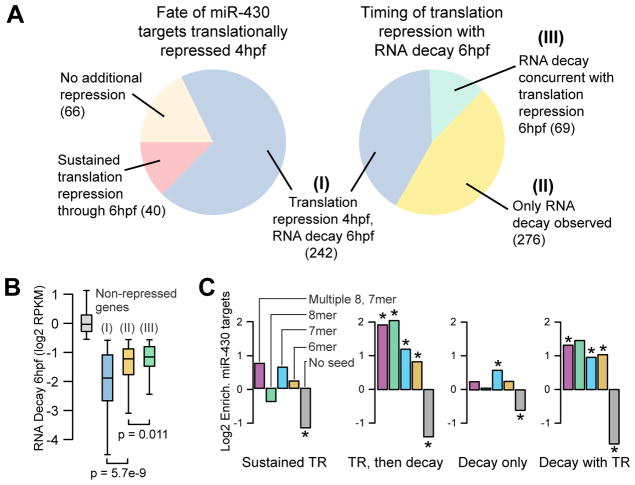
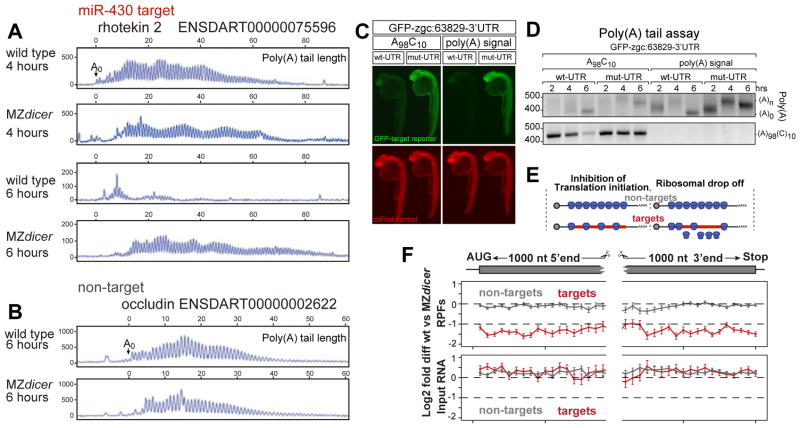
MicroRNAs regulate gene expression through deadenylation, repression, and messenger RNA (mRNA) decay. However, the contribution of each mechanism in non-steady-state situations remains unclear. We monitored the impact of miR-430 on ribosome occupancy of endogenous mRNAs in wild-type and dicer mutant zebrafish embryos and found that miR-430 reduces the number of ribosomes on target mRNAs before causing mRNA decay. Translational repression occurs before complete deadenylation, and disrupting deadenylation with use of an internal polyadenylate tail did not block target repression. Lastly, we observed that ribosome density along the length of the message remains constant, suggesting that translational repression occurs by reducing the rate of initiation rather than affecting elongation or causing ribosomal drop-off. These results show that miR-430 regulates translation initiation before inducing mRNA decay during zebrafish development.


Figures

Figure 1
Figure 1. Temporal analysis of miR-430 mediated translational repression in zebrafish
(A) In situ hybridization (purple) for miR-430 target gene sod1 in wild type and MZdicer embryos at 2, 4 and 6 hpf. Note that decay of the target is observed at 6hpf in a miRNA-dependent manner. (B) Northern blot showing miR-430 expression in wild type and MZdicer. (C) Ribosome protected fragments (RPF) and input reads mapped to a composite transcript. RPFs mainly map to the CDS. Input reads map to both the UTR and CDS. (D–F) Biplots show log2-fold RPKM differences of RPFs (y axis) and mRNA (x axis) between wild type and MZdicer at 2 (D), 4 (E) and 6 (F) hpf. Known miR-430 targets are in red (15), non-targets lacking miR-430 seeds in gray. Mean values per group are indicated as lines. Mean difference between targets and non targets:(E) RPF 2.26-fold, p=1.3e-24; RNA, 1.05-fold, p=0.12; (F) RPF 4.6-fold, p=1.5e-44; RNA 3.1-fold, p=8.1e-44, by two-sided Wilcoxon rank sum test.
Figure 2
Figure 2. miR-430 induces translation repression prior to RNA decay
(A)Cumulative distributions of mRNA, RPF, and translation efficiency differences (Δ) between wild type and MZdicer for known miR-430 targets (red), all genes with 3′UTR miR-430 seed sites (blue), and non targets (gray), with number of genes in parentheses. P values for rank-sum tests are shown for non-targets vs. known targets (red) and vs. all predicted targets (blue). (B, C) Cumulative distribution plots with predicted targets separated by seed type as indicated.
Figure 3
Figure 3. miR-430 induces translation repression followed by RNA decay
(A) Pie charts of different repression categories (cutoffs defined in Fig. S7). 70% of the targets translationally repressed at 4hpf go on to be deadenylated or degraded at 6hpf (Group I). Among transcripts decayed 6hpf, 41% were translationally repressed 4hpf (I), 47% were not observed to be translationally repressed (II), and the remainder experience concurrent translation repression 6hpf not explained by the decay (III). (B) Box and whisker plot showing that the level of RNA decay at 6hpf is highest among genes that are translationally repressed early. (C) The different modes of repression induce significant enrichment in miR-430 target seeds (* indicates p<0.05, Fisher’s exact test). See Table S2 for counts.
Figure 4
Figure 4. Poly(A) length and ribosome distribution
(A, B) Single nucleotide resolution electrophoresis for poly(A) length for a target (A) and non-target (B) in wild type and MZdicer (14). A0 represents the polyadenylation site confirmed by DNA sequencing (fig. S9). (C)GFP expression (green) from an injected miR-430 reporter mRNA containing the 3′UTR for zgc:63829 with wild type (wt-UTR) or mutated (mut-UTR) miR-430 sites. The 3′UTRs are followed by an internal poly(A) tail (A98C10) or a polyadenylation signal. Expression of a co-injected dsRed control mRNA is shown in red. Note the repression of the wild-type reporter compared to the mutant reporter when a internal polyA tail is used. (D) Gel electrophoresis of a PCR to determine the length of the poly(A) tail (ending in A, upper panel) and A98C10 (below). Note the polyadenylation by 2hpf and deadenylation by 6hpf, but deadenylation of the mRNA with the internal polyA tail (A98C10)is delayed. Estimated size of the deadenylated product is shown as (A0). (E) Two models for translational repression: reducing translation initiation (left) or causing ribosome drop off/slower elongation rate (right). (F) Plot showing relative RPF read density (top) and mRNA density (bottom) along the length of miR-430 targets (red) undergoing >1.5-fold translation repression at 4hpf; and non-targets (gray). Points show mean +/− SEM log2 fold differences between wild type and MZdicer expression in 50nt bins spanning the first and last 1000 nts of the genes (14). Bins represent 41≥N≥277 genes for targets, 107≥N≥906 genes for non targets. Bin values do not significantly differ (p=0.53, Friedman rank sum test).

Comment in

  • Small RNAs: miRNAs' strict schedule.
    David R. David R. Nat Rev Genet. 2012 May 3;13(6):378. doi: 10.1038/nrg3251. Nat Rev Genet. 2012. PMID: 22552258 No abstract available.
  • miRNAs' strict schedule.
    David R. David R. Nat Rev Mol Cell Biol. 2012 May 3;13(6):340-1. doi: 10.1038/nrm3354. Nat Rev Mol Cell Biol. 2012. PMID: 22552328 No abstract available.

References

    1. Fabian MR, Sonenberg N, Filipowicz W. Regulation of mRNA translation and stability by microRNAs. Annu Rev Biochem. 2010;79:351. - PubMed
    1. Djuranovic S, Nahvi A, Green R. A parsimonious model for gene regulation by miRNAs. Science. 2011;331:550. - PMC - PubMed
    1. Pillai RS, et al. Inhibition of translational initiation by Let-7 MicroRNA in human cells. Science. 2005;309:1573. - PubMed
    1. Olsen PH, Ambros V. The lin-4 regulatory RNA controls developmental timing in Caenorhabditis elegans by blocking LIN-14 protein synthesis after the initiation of translation. Dev Biol. 1999;216:671. - PubMed
    1. Lee RC, Feinbaum RL, Ambros V. The C. elegans heterochronic gene lin-4 encodes small RNAs with antisense complementarity to lin-14. Cell. 1993;75:843. - PubMed

Publication types

MeSH terms

Associated data