Comparative Study
. 2012 Apr 13;336(6078):193-8.
doi: 10.1126/science.1216872. Epub 2012 Mar 15.

A fine-scale chimpanzee genetic map from population sequencing

Affiliations
Comparative Study

A fine-scale chimpanzee genetic map from population sequencing

Adam Auton et al. Science. .

Abstract

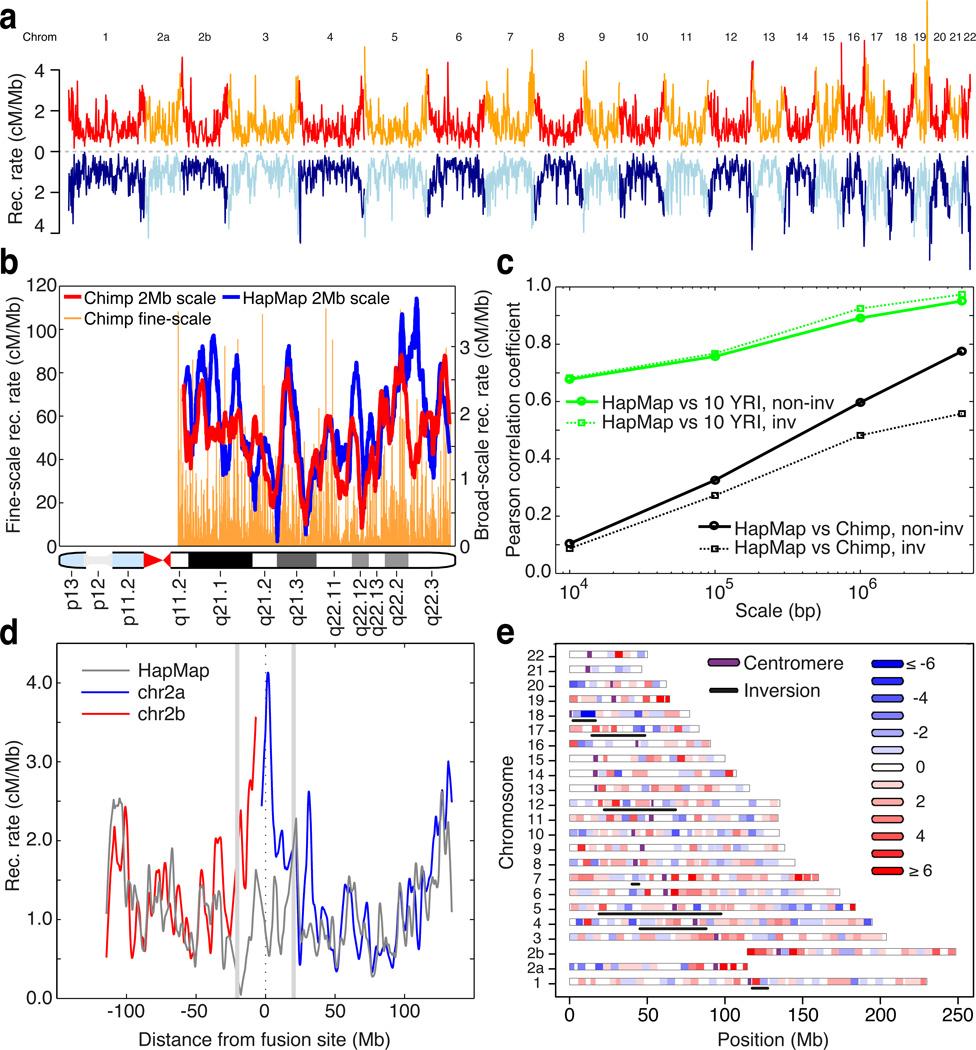
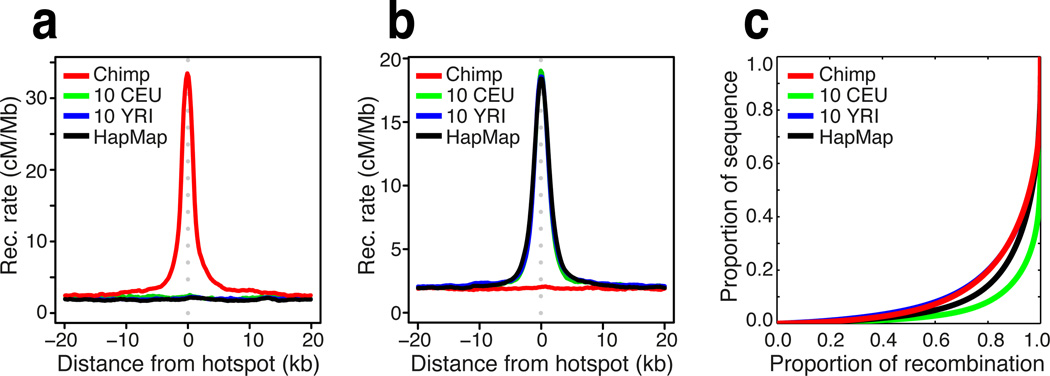
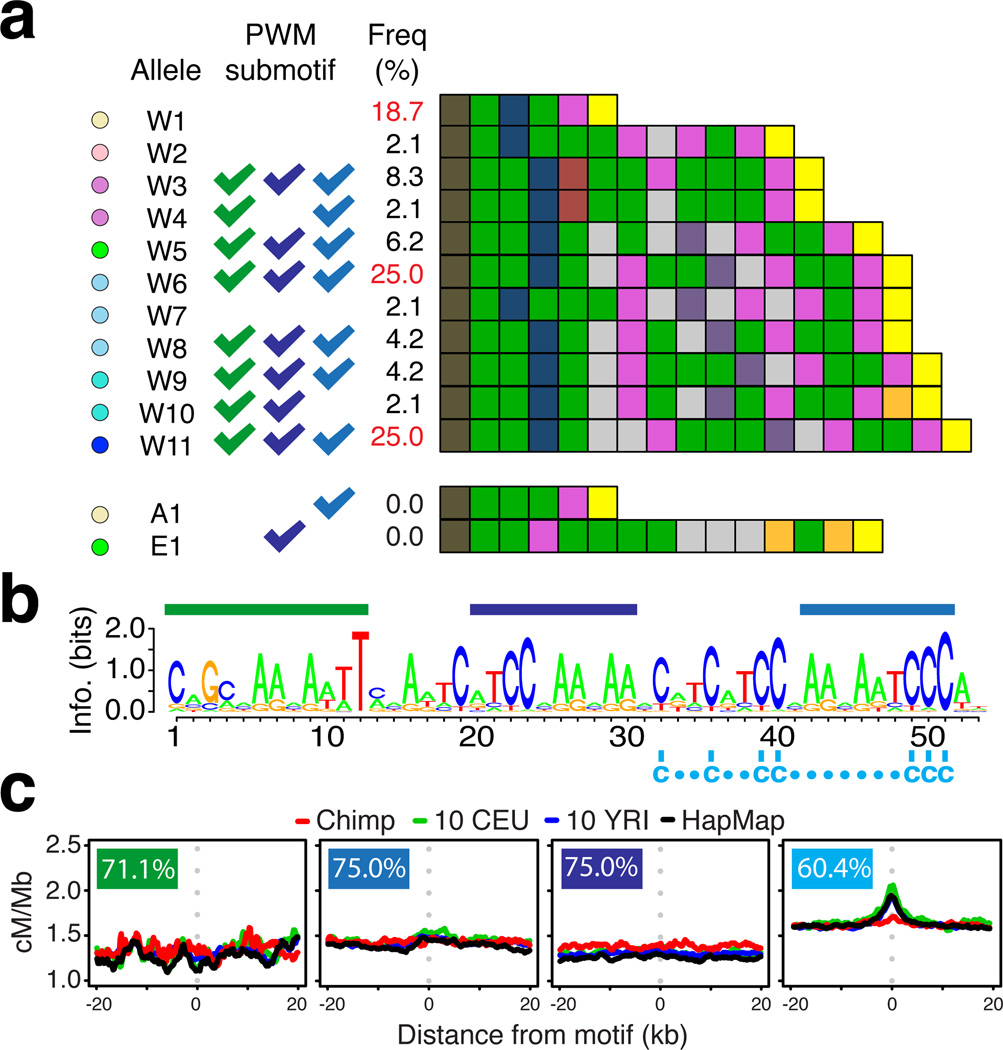
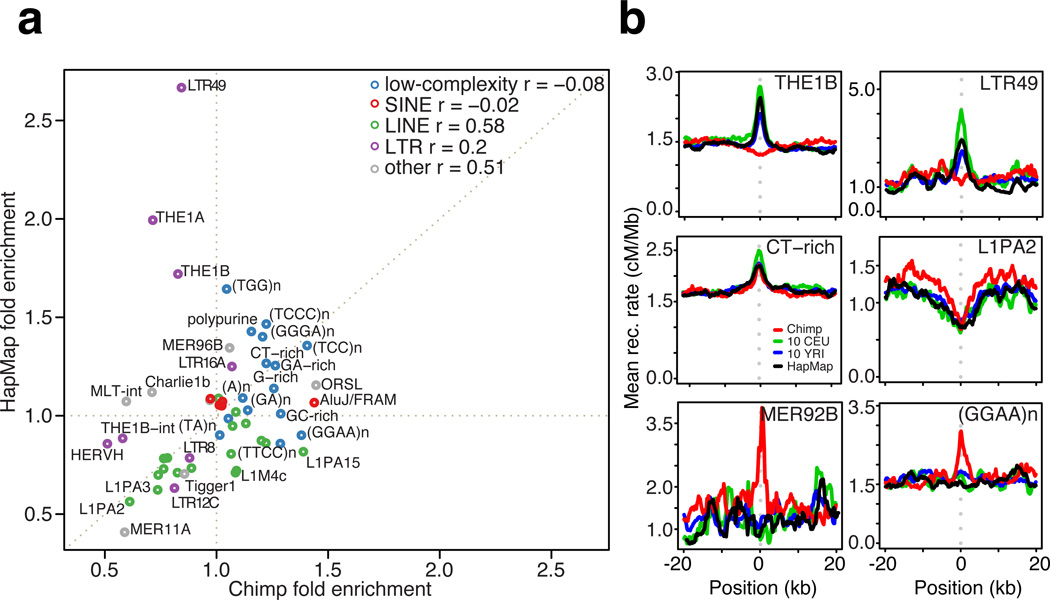
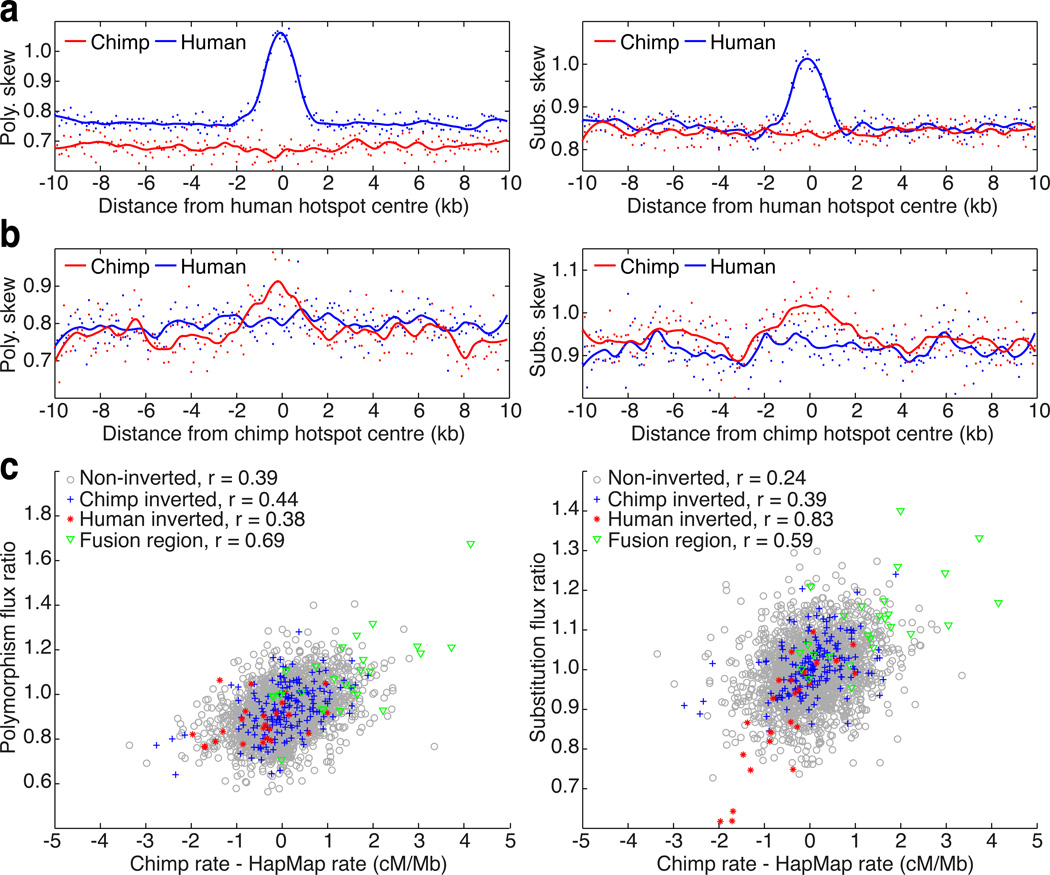
To study the evolution of recombination rates in apes, we developed methodology to construct a fine-scale genetic map from high-throughput sequence data from 10 Western chimpanzees, Pan troglodytes verus. Compared to the human genetic map, broad-scale recombination rates tend to be conserved, but with exceptions, particularly in regions of chromosomal rearrangements and around the site of ancestral fusion in human chromosome 2. At fine scales, chimpanzee recombination is dominated by hotspots, which show no overlap with those of humans even though rates are similarly elevated around CpG islands and decreased within genes. The hotspot-specifying protein PRDM9 shows extensive variation among Western chimpanzees, and there is little evidence that any sequence motifs are enriched in hotspots. The contrasting locations of hotspots provide a natural experiment, which demonstrates the impact of recombination on base composition.


Figures

Figure 1
Figure 1
Evolution of recombination rates between humans and chimpanzees. (a) Genome-wide comparison of recombination rates for chimpanzee (red / orange) and human (light / dark blue); averaged over 1 Mb windows in regions of synteny. Unless otherwise stated, human rates are from the population-averaged HapMap genetic map (16). (b) Recombination rates estimated in human (blue) and chimpanzee (red) along chromosome 21q, averaged over 2Mb intervals; fine-scale rates shown behind. (c) Pearson correlation coefficients at different scales, estimated between the recombination rates of chimpanzee and HapMap YRI (black), and between chimpanzee and ten 1000 Genomes YRI samples (green). Non-inverted regions: solid lines, inverted regions: dotted lines). (d) Recombination rates in 2Mb syntenic windows along chimpanzee chromosomes 2a and 2b (blue, red) and the corresponding syntenic region of human chromosome 2 (grey) derived from an ancient telomeric fusion. (e) Differences between chimpanzee and human recombination rates in 5Mb syntenic windows across the genome. Regions involved in inversions are underlined.
Figure 2
Figure 2
(a) Recombination rates around hotspots identified in chimpanzee (red) at syntenic regions in CEU (green), YRI (blue), and HapMap (black). (b) As for (a) but around sites identified as recombination hotspots in 10 YRI; see also Figure S4. (c) The concentration of recombination rate in fine-scale genetic maps estimated from the chimpanzee and equivalent data from human populations of European (CEU) and African (YRI) ancestry (23). The higher degree of concentration see in African relative to European populations likely reflects the greater diversity of PRDM9 alleles in the population (11).
Figure 3
Figure 3
The fine-scale profile of recombination rate variation around genomic features in chimpanzees and humans. (a) Average recombination rate as a function of distance to nearest transcription start site (TSS) and transcription end site (TES) in chimpanzee (red), YRI (blue), CEU (green), and HapMap (black). (b) Average recombination rate as a function of distance to nearest CpG island; colours as for panel (a). Dashed lines indicate start and end of elements, estimates smoothed using running average with a 7.5kb window.
Figure 4
Figure 4
Sequence and structural variation in chimpanzee PRDM9 and implications for hotspot motifs. (a) Schematic representations of the zinc-finger arrays found in chimpanzee PRDM9 alleles with colours representing unique combinations of DNA-contacting amino acids within zinc fingers. Western chimpanzee alleles are labelled W1 through W11. Also shown is the putatively ancestral allele shared between Bonobo and Eastern chimpanzee (A1), and the remaining detected Eastern chimpanzee allele (E1). Tick marks indicate binding specificity to motifs indicated in panel (c). Allele frequencies estimated from 48 Western chimpanzees alleles. (b) Predicted binding motif for the chimpanzee reference PRDM9 allele (W6) showing positions of shared sub-motifs referred to in parts (a) and (c) and a shared set of C residues (below sequence). (c) Recombination rates around shared predicted sub-motifs for chimpanzee PRDM9 alleles in non-repeat DNA (percent of alleles predicted to bind indicated).
Figure 5
Figure 5
Recombination rates around DNA repeat elements in chimpanzees and humans. (a) Recombination-influencing activity of repeat element families in chimpanzees and humans (HapMap). The value reported is the ratio of the peak rate to background rate, as estimated from the robust genetic map after fitting a Gaussian profile using maximum likelihood. Selected repeat elements are labelled. (b) Recombination rate profiles around selected repeat elements, as estimated in the robust map. Top: two elements (THE1B and LTR49) that are recombination-promoting in humans only. Middle: Elements that are recombination-promoting (CT-rich repeats) or recombination suppressing (L1PA2) in both humans and chimpanzees. Bottom: Two elements (GGAAn and MER92B) that are recombination-promoting in chimpanzees only.
Figure 6
Figure 6
The influence of broad and fine-scale changes in recombination rate on GC-promoting mutations. (a) GC-skew (defined as the ratio of the number of GC increasing changes compared to GC decreasing changes; see Supplementary Material) in both polymorphism (left) and substitutions (right). Estimates from mutations on the human lineage are indicated in blue, whereas those on the chimpanzee lineage are in red. Smoothed lines estimated using loess. The observed increase in skew in human is completely absent in chimpanzee. (b) As for (a), but around hotspots detected in chimpanzee. While the pattern of skew in chimpanzee is considerably weaker than for (a), no corresponding skew is observed in human. (c) Broad-scale (1Mb) effects of changes in recombination rate between chimpanzees and humans on patterns of GC-skew in polymorphism (left) and substitution (right). Flux ratio is defined as the ratio of the GC skews in chimpanzee compared to human. Chimpanzee recombination rate estimates from the robust genetic map. Colours indicate different parts of the genome, with Pearson correlation coefficient indicated.

Comment in

References

    1. Coop G, Przeworski M. Nat Rev Genet. 2007 Jan;8:23. - PubMed
    1. Myers S, et al. Science. 2010 Feb 12;327:876. - PubMed
    1. Ptak SE, et al. Nat Genet. 2005 Apr;37:429. - PubMed
    1. Ptak SE, et al. PLoS Biol. 2004 Jun;2:e155. - PMC - PubMed
    1. Winckler W, et al. Science. 2005 Apr 1;308:107. - PubMed

Publication types

Substances